

doi: 10.1186/1475-2859-7-12.
Folding and assembly of large macromolecular complexes monitored by hydrogen-deuterium exchange and mass spectrometry
Affiliations
- PMID: 18394161
- PMCID: PMC2365927
- DOI: 10.1186/1475-2859-7-12
Item in Clipboard
Folding and assembly of large macromolecular complexes monitored by hydrogen-deuterium exchange and mass spectrometry
Microb Cell Fact.
.
Abstract
Recent advances in protein mass spectrometry (MS) have enabled determinations of hydrogen deuterium exchange (HDX) in large macromolecular complexes. HDX-MS became a valuable tool to follow protein folding, assembly and aggregation. The methodology has a wide range of applications in biotechnology ranging from quality control for over-expressed proteins and their complexes to screening of potential ligands and inhibitors. This review provides an introduction to protein folding and assembly followed by the principles of HDX and MS detection, and concludes with selected examples of applications that might be of interest to the biotechnology community.
Figures
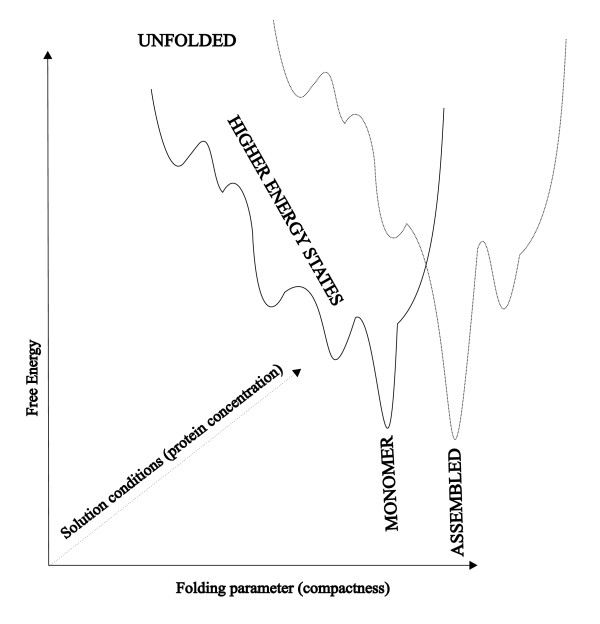
A schematic, one dimensional cross-section of the multidimensional energy landscape projected along a specific folding reaction coordinate.
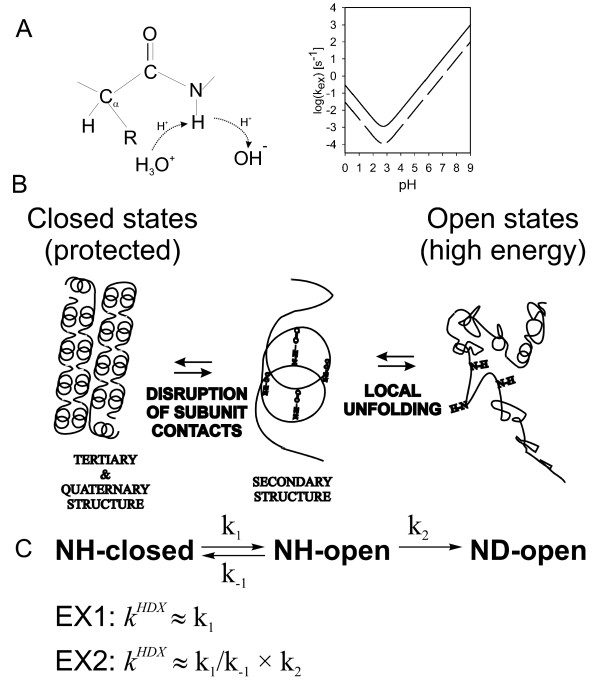
Mechanism of HDX. (A) Mechanism of the chemical step. Inset on the right illustrates the pH and temperature (solid line 25°C, dashed line 0°C) dependence of the intrinsic exchange rate (B) Influence of quaternary, tertiary and secondary structure on HDX. (C) Overall reaction scheme and the two limiting cases.
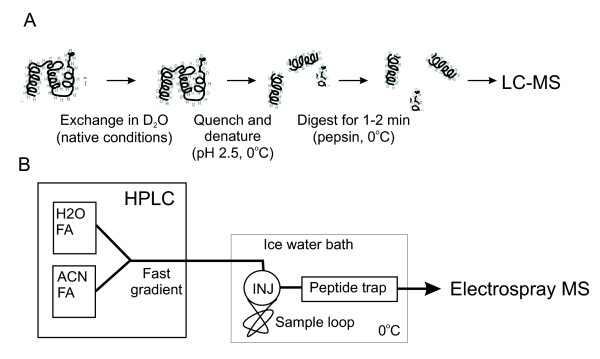
Practical aspects of HDX measurement. (A) Simplified exchange and protease digestion protocol. (B) Cooled LC-MS setup, INJ = injector [64].
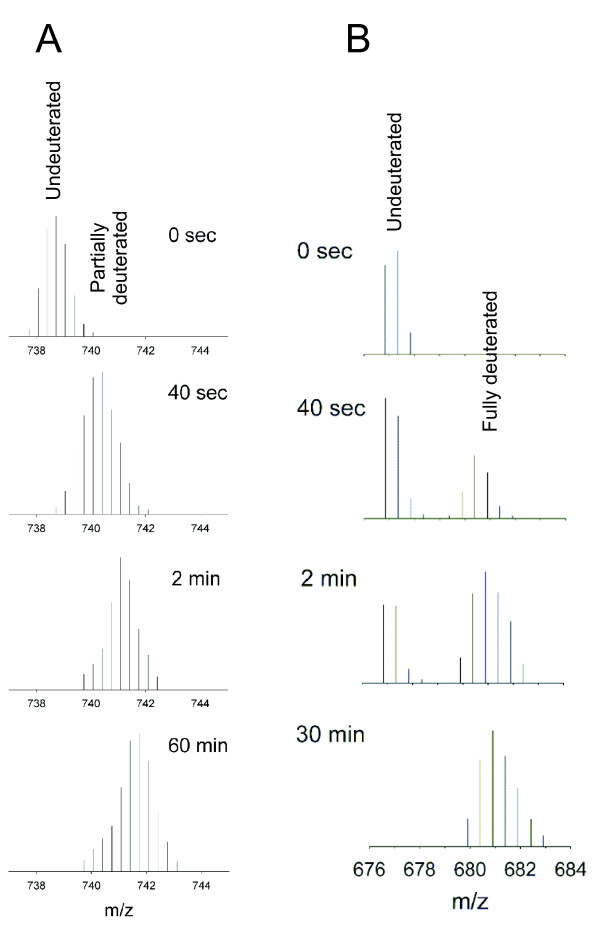
Example of HDX detected by mass spectra. m/z isotopic envelopes for EX2 (A) and EX1 (B) limit of exchange. Data obtained for a region that is situated within the subunit interface in ϕ8 P4 hexamer [114].
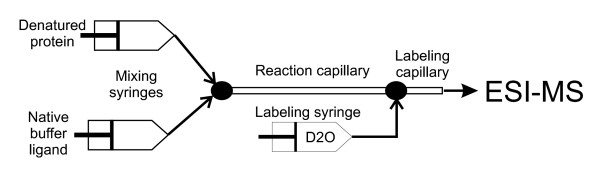
Schematics of on-line folding and pulse labeling apparatus (based on [102]).
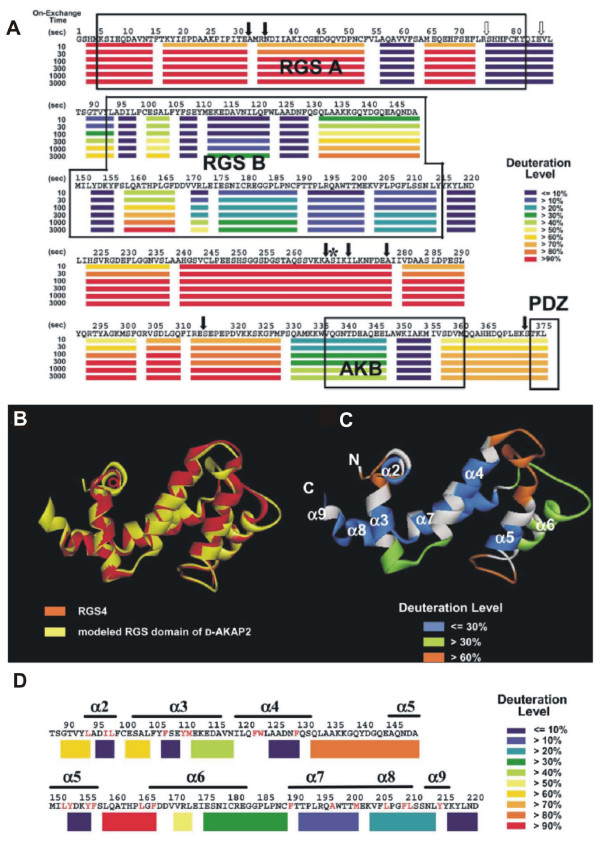
Domain structure of D-AKAP2 scaffolding protein. (A) Graphical representation of deuteration levels at different time points is shown in color (scale on the right) below the sequence. (B) Backbone homology-based model of the RGS domain (C) Color representation of deuteration levels after 3000 s mapped onto the modeled structure. (D) Deuteration levels after 3000 s mapped onto the primary structure. From [106] with permission.
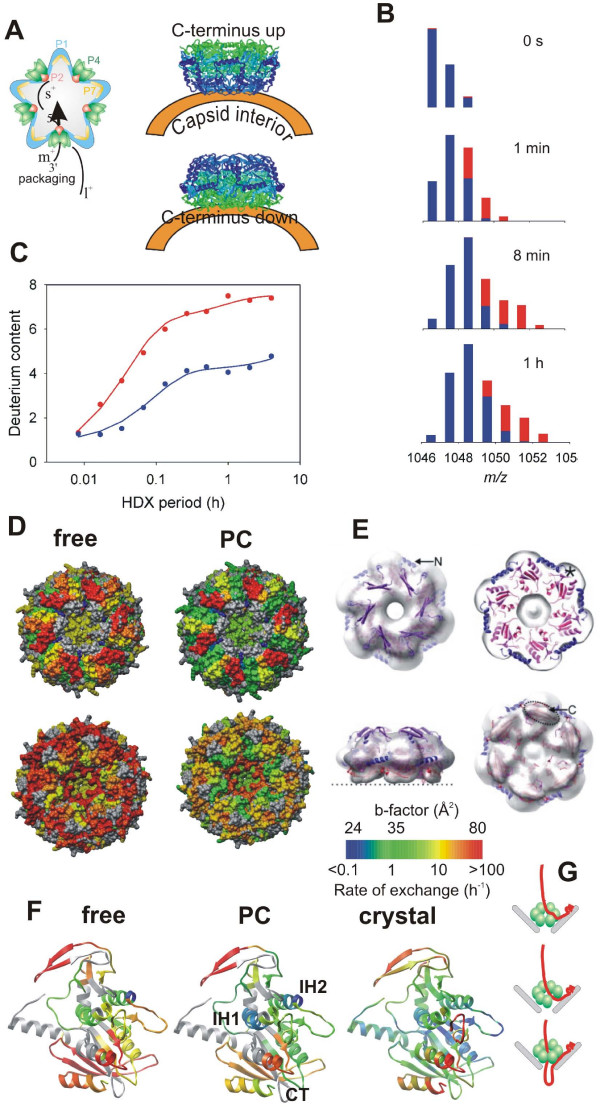
Mapping subunit interfaces and dynamics in large viral assembly- P4 hexamer within ϕ12 procapsid [94]. (A) Schematics of the viral procapsid (PC) and packaging of ssRNA precursors by the P4 hexamers associated with the capsid vertices (left). The right panel illustrates the problem of determining the orientation of the hexamer with respect to the procapsid. (B) Bar representation of the isotopic envelopes during progressive deuteration, free hexamer in red and PC-bound in blue. (C) The HDX kinetics derived from centroid positions of the isotopic envelopes in panel B (and from additional data not shown). (D) Mapping of average exchange rates onto P4 structure in surface color representation (color scale on the bottom right). (E) Fitting of the P4 hexamer into the EM-derived electron density using the correct orientation from HDX experiment (adopted from [113]). (F) Average exchange rates mapped onto the ribbon diagram of P4 subunit for free (left) and PC-bound (middle) hexamer together with the scaled crystallographic temperature factors (B-factors, right panel). Color scale as in panel D. (G) Schematics of ssRNA loading into the hexameric packaging motor via ring opening mechanism. Top: A specific viral RNA structure (packaging signal) is recognized by the major capsid protein P1 which brings the polynucleotide strand to the vicinity of P4. Middle: P4 ring opens and lets the RNA slip in between subunit interfaces into the central channel. Bottom: The ring topologically encloses the bound RNA and translocates RNA in 5' to 3' direction into the capsid at the expense of ATP hydrolysis (packaging).
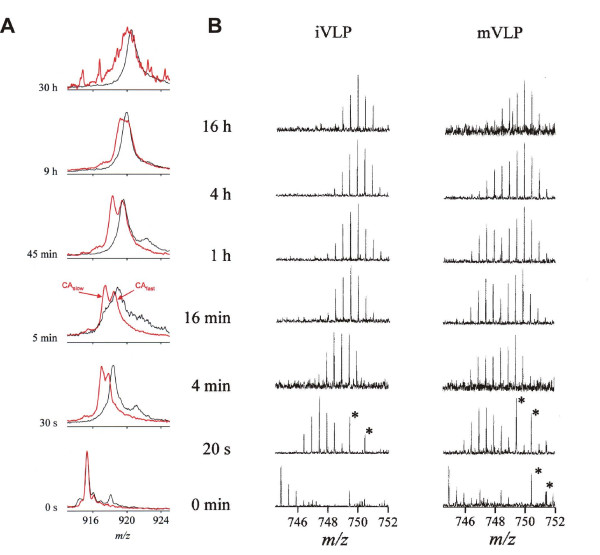
Structural changes during HIV maturation [71, 115, 116]. (A) Progress of deuteration for the intact capsid protein (+28 charge state, 25 601 Da) in mature virus-like-particles (mVLP, red) and as disassembled monomer in solution (black). (B) Time-resolved isotopic envelopes for the peptic fragment encompassing residues 55–68 of the CA protein in immature (left) and mature (right) VLPs. The peaks marked by asterisk do not belong to the CA fragment envelopes. From [71] with permission.
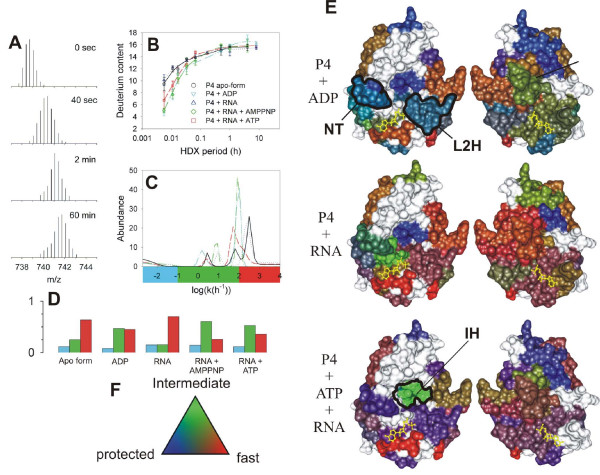
Mapping functional dynamics in the hexamer of P4 from bacteriophage ϕ8 [114]. Mass/charge (m/z) spectra corresponding to the peptic fragment encompassing residues 139–158 (m = 2210.14 Da, z = 3) during H/D exchange (only interval 0 to 60 min shown). (B) Increase of deuterium content in the peptide (symbols) and the corresponding maximum entropy fit (MEM) for P4 alone (black circles, solid line), P4+1 mM poly(C) (blue triangles, dotted), P4 + 1 mM poly(C) + 1 mM ATP (red squares, dashed line), P4 + 1 mM poly(C) + 1 mM AMP-PNP (green diamonds, dash-dot-dot) and P4 + 1 mM ADP (cyan inverted triangles, dash-dot). Standard deviations (error bars) were estimated from three independent experiments. (C) Rate distributions obtained by MEM fitting of data in panel B. The color bar under the panel indicates the three integration regions which were used to obtain the number of sites within each rate class (blue = slow/protected, green = intermediate, red = fast/unprotected). (D) Number of amide sites in the three classes and under different conditions (nucleotide di/triphosphates, RNA binding) obtained from data in panel C, bar colors as in panel C. (E) RGB representation of the HDX kinetics for subunit interfaces. The two facets (left and right) represent the facing interfaces from the neighboring subunits in a surface representation. Bound ATP molecule is shown in yellow ball-and-stick representation. Several regions of interest are delineated: NT-nucleotide binding pocket; L2H-loop 2 and α-helix 6 which constitute the moving lever of the motor; IH-interfacial helix which becomes transiently exposed during ring opening and RNA loading. (F) Three-color, RGB scale for number of amides exchanging in the three classes.
Similar articles
-
Hydrogen-Deuterium Exchange Coupled to Top- and Middle-Down Mass Spectrometry Reveals Histone Tail Dynamics before and after Nucleosome Assembly.Structure. 2018 Dec 4;26(12):1651-1663.e3. doi: 10.1016/j.str.2018.08.006. Epub 2018 Oct 4. Structure. 2018. PMID: 30293810 Free PMC article.
-
A Hydrogen-Deuterium Exchange Mass Spectrometry (HDX-MS) Platform for Investigating Peptide Biosynthetic Enzymes.J Vis Exp. 2020 May 4;(159). doi: 10.3791/61053. J Vis Exp. 2020. PMID: 32420996
-
Using Hydrogen-Deuterium Exchange Mass Spectrometry to Examine Protein-Membrane Interactions.Methods Enzymol. 2017;583:143-172. doi: 10.1016/bs.mie.2016.09.008. Epub 2016 Oct 18. Methods Enzymol. 2017. PMID: 28063489 Review.
-
Hydrogen deuterium exchange mass spectrometry applied to chaperones and chaperone-assisted protein folding.Expert Rev Proteomics. 2019 Jul;16(7):613-625. doi: 10.1080/14789450.2019.1633920. Epub 2019 Jun 24. Expert Rev Proteomics. 2019. PMID: 31215268 Review.
-
Online Hydrogen-Deuterium Exchange Traveling Wave Ion Mobility Mass Spectrometry (HDX-IM-MS): a Systematic Evaluation.J Am Soc Mass Spectrom. 2017 Jun;28(6):1192-1202. doi: 10.1007/s13361-017-1633-z. Epub 2017 Apr 3. J Am Soc Mass Spectrom. 2017. PMID: 28374315 Free PMC article.
Cited by
-
Characterizing Protein Structure, Dynamics and Conformation in Lyophilized Solids.Curr Pharm Des. 2015;21(40):5845-53. doi: 10.2174/1381612821666151008150735. Curr Pharm Des. 2015. PMID: 26446463 Free PMC article. Review.
-
Mapping the protein-protein interface between a toxin and its cognate antitoxin from the bacterial pathogen Streptococcus pyogenes.Biochemistry. 2011 May 17;50(19):4038-45. doi: 10.1021/bi200244k. Epub 2011 Apr 19. Biochemistry. 2011. PMID: 21466233 Free PMC article.
-
Two-stage, self-cycling process for the production of bacteriophages.Microb Cell Fact. 2010 Nov 1;9:81. doi: 10.1186/1475-2859-9-81. Microb Cell Fact. 2010. PMID: 21040541 Free PMC article.
-
Protein-peptide affinity determination using an h/d exchange dilution strategy: application to antigen-antibody interactions.J Am Soc Mass Spectrom. 2010 Oct;21(10):1660-7. doi: 10.1016/j.jasms.2010.03.030. Epub 2010 Mar 28. J Am Soc Mass Spectrom. 2010. PMID: 20444623 Free PMC article.
-
Estimating Constraints for Protection Factors from HDX-MS Data.Biophys J. 2019 Apr 2;116(7):1194-1203. doi: 10.1016/j.bpj.2019.02.024. Epub 2019 Mar 5. Biophys J. 2019. PMID: 30885379 Free PMC article.
References
LinkOut - more resources
Full Text Sources
Other Literature Sources
