

Gap junction channels exhibit connexin-specific permeability to cyclic nucleotides
- PMID: 18378798
- PMCID: PMC2279171
- DOI: 10.1085/jgp.200709934
Gap junction channels exhibit connexin-specific permeability to cyclic nucleotides
Abstract
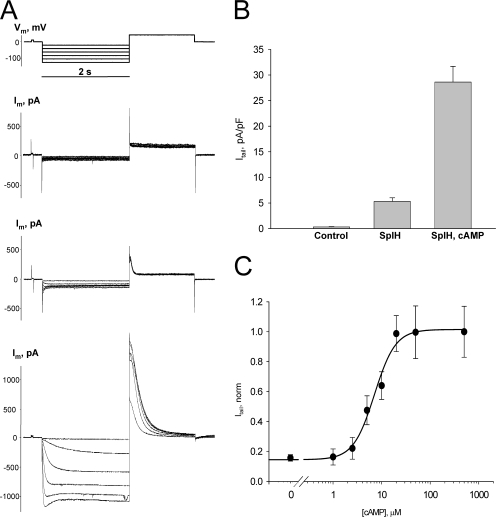
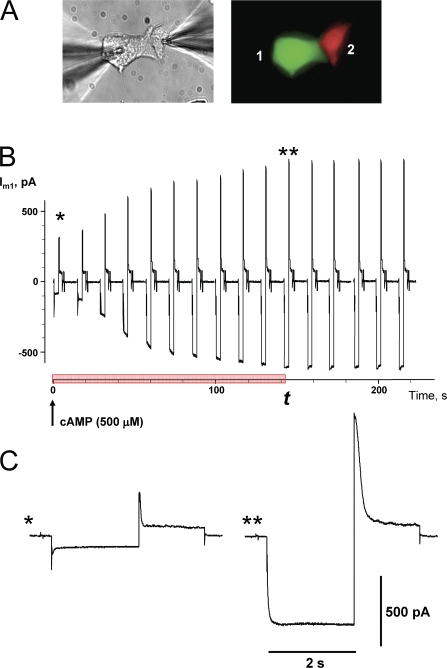
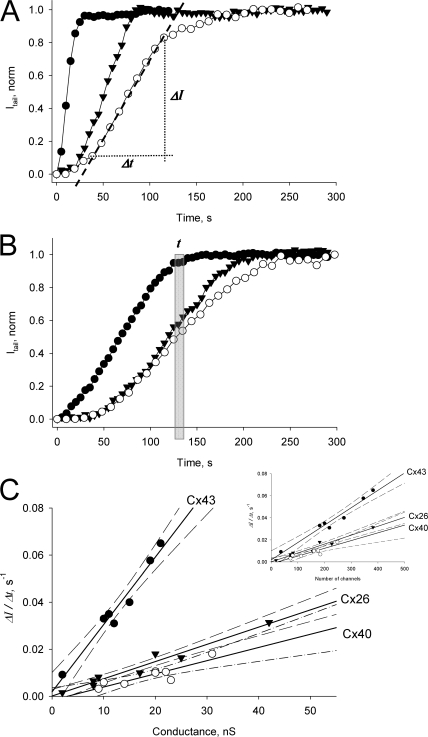
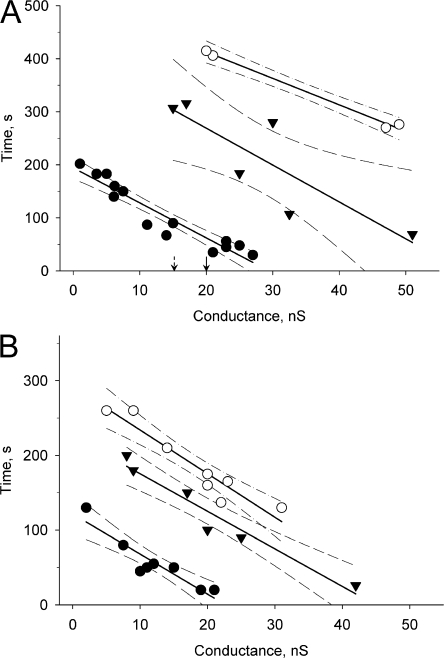
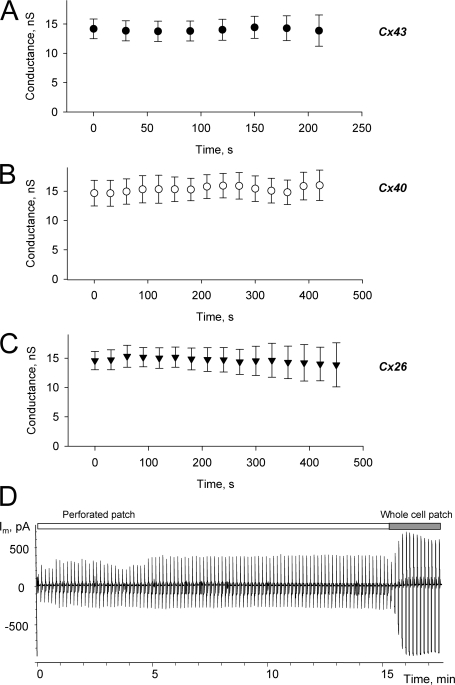
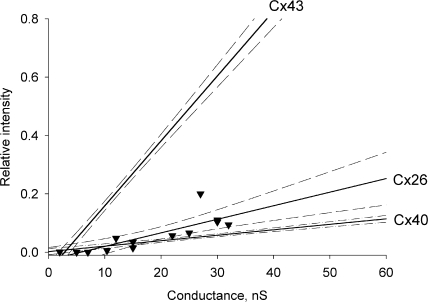
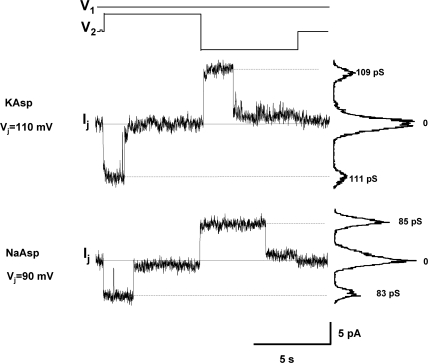
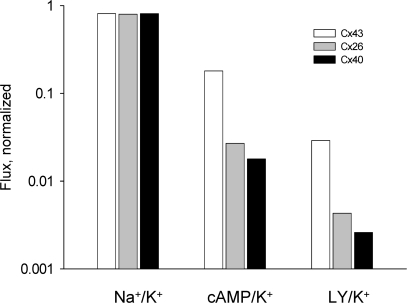
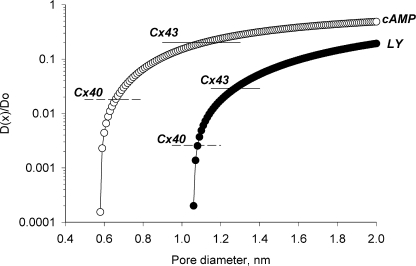
Gap junction channels exhibit connexin dependent biophysical properties, including selective intercellular passage of larger solutes, such as second messengers and siRNA. Here, we report the determination of cyclic nucleotide (cAMP) permeability through gap junction channels composed of Cx43, Cx40, or Cx26 using simultaneous measurements of junctional conductance and intercellular transfer of cAMP. For cAMP detection the recipient cells were transfected with a reporter gene, the cyclic nucleotide-modulated channel from sea urchin sperm (SpIH). cAMP was introduced via patch pipette into the cell of the pair that did not express SpIH. SpIH-derived currents (I(h)) were recorded from the other cell of a pair that expressed SpIH. cAMP diffusion through gap junction channels to the neighboring SpIH-transfected cell resulted in a five to sixfold increase in I(h) current over time. Cyclic AMP transfer was observed for homotypic Cx43 channels over a wide range of conductances. However, homotypic Cx40 and homotypic Cx26 exhibited reduced cAMP permeability in comparison to Cx43. The cAMP/K(+) permeability ratios were 0.18, 0.027, and 0.018 for Cx43, Cx26, and Cx40, respectively. Cx43 channels were approximately 10 to 7 times more permeable to cAMP than Cx40 or Cx26 (Cx43 > Cx26 > or = Cx40), suggesting that these channels have distinctly different selectivity for negatively charged larger solutes involved in metabolic/biochemical coupling. These data suggest that Cx43 permeability to cAMP results in a rapid delivery of cAMP from cell to cell in sufficient quantity before degradation by phosphodiesterase to trigger relevant intracellular responses. The data also suggest that the reduced permeability of Cx26 and Cx40 might compromise their ability to deliver cAMP rapidly enough to cause functional changes in a recipient cell.
Figures
Comment in
-
Connexin specificity of second messenger permeation: real numbers at last.J Gen Physiol. 2008 Apr;131(4):287-92. doi: 10.1085/jgp.200809998. J Gen Physiol. 2008. PMID: 18378797 Free PMC article. No abstract available.
Similar articles
-
Lens Connexin Channels Have Differential Permeability to the Second Messenger cAMP.Invest Ophthalmol Vis Sci. 2019 Sep 3;60(12):3821-3829. doi: 10.1167/iovs.19-27302. Invest Ophthalmol Vis Sci. 2019. PMID: 31529078 Free PMC article.
-
Gap junction permeability: selectivity for anionic and cationic probes.Am J Physiol Cell Physiol. 2011 Mar;300(3):C600-9. doi: 10.1152/ajpcell.00316.2010. Epub 2010 Dec 9. Am J Physiol Cell Physiol. 2011. PMID: 21148413 Free PMC article.
-
Cardiac gap junction channels show quantitative differences in selectivity.Circ Res. 2002 Jul 26;91(2):104-11. doi: 10.1161/01.res.0000025638.24255.aa. Circ Res. 2002. PMID: 12142342
-
Defining the factors that affect solute permeation of gap junction channels.Biochim Biophys Acta Biomembr. 2018 Jan;1860(1):96-101. doi: 10.1016/j.bbamem.2017.07.002. Epub 2017 Jul 6. Biochim Biophys Acta Biomembr. 2018. PMID: 28690048 Free PMC article. Review.
-
Lens Connexin Channels Show Differential Permeability to Signaling Molecules.Int J Mol Sci. 2020 Sep 22;21(18):6943. doi: 10.3390/ijms21186943. Int J Mol Sci. 2020. PMID: 32971763 Free PMC article. Review.
Cited by
-
An Assay to Assess Gap Junction Communication in Cell Lines.J Biomol Tech. 2019 Apr;30(1):1-6. doi: 10.7171/jbt.19-3001-001. J Biomol Tech. 2019. PMID: 30723387 Free PMC article.
-
Cyclic AMP mediates ovine cumulus-oocyte gap junctional function via balancing connexin 43 expression and phosphorylation.Endocr Connect. 2023 Oct 12;12(11):e230337. doi: 10.1530/EC-23-0337. Print 2023 Nov 1. Endocr Connect. 2023. PMID: 37855365 Free PMC article.
-
A two-dimensional finite element model of intercellular cAMP signaling through gap junction channels.J Biomech. 2023 May;152:111588. doi: 10.1016/j.jbiomech.2023.111588. Epub 2023 Apr 18. J Biomech. 2023. PMID: 37094384 Free PMC article.
-
Gap junctions and blood-tissue barriers.Adv Exp Med Biol. 2012;763:260-80. doi: 10.1007/978-1-4614-4711-5_13. Adv Exp Med Biol. 2012. PMID: 23397629 Free PMC article.
-
Gap junctions and cancer: communicating for 50 years.Nat Rev Cancer. 2016 Dec;16(12):775-788. doi: 10.1038/nrc.2016.105. Epub 2016 Oct 21. Nat Rev Cancer. 2016. PMID: 27782134 Free PMC article. Review.
References
-
- Arnould, T., D. Janssens, C. Michiels, and J. Remacle. 1996. Effect of aescine on hypoxia-induced activation of human endothelial cells. Eur. J. Pharmacol. 315:227–233. - PubMed
-
- Barbe, M.T., H. Monyer, and R. Bruzzone. 2006. Cell-cell communication beyond connexins: the pannexin channels. Physiology (Bethesda). 21:103–114. - PubMed
Publication types
MeSH terms
Substances
Grants and funding
LinkOut - more resources
Full Text Sources
Other Literature Sources
Miscellaneous
