Comparative Study
. 2008 Aug 15;414(1):31-41.
doi: 10.1042/BJ20071240.

Sphingomyelin synthases regulate production of diacylglycerol at the Golgi

Affiliations
Comparative Study

Sphingomyelin synthases regulate production of diacylglycerol at the Golgi

Maristella Villani et al. Biochem J. .

Abstract

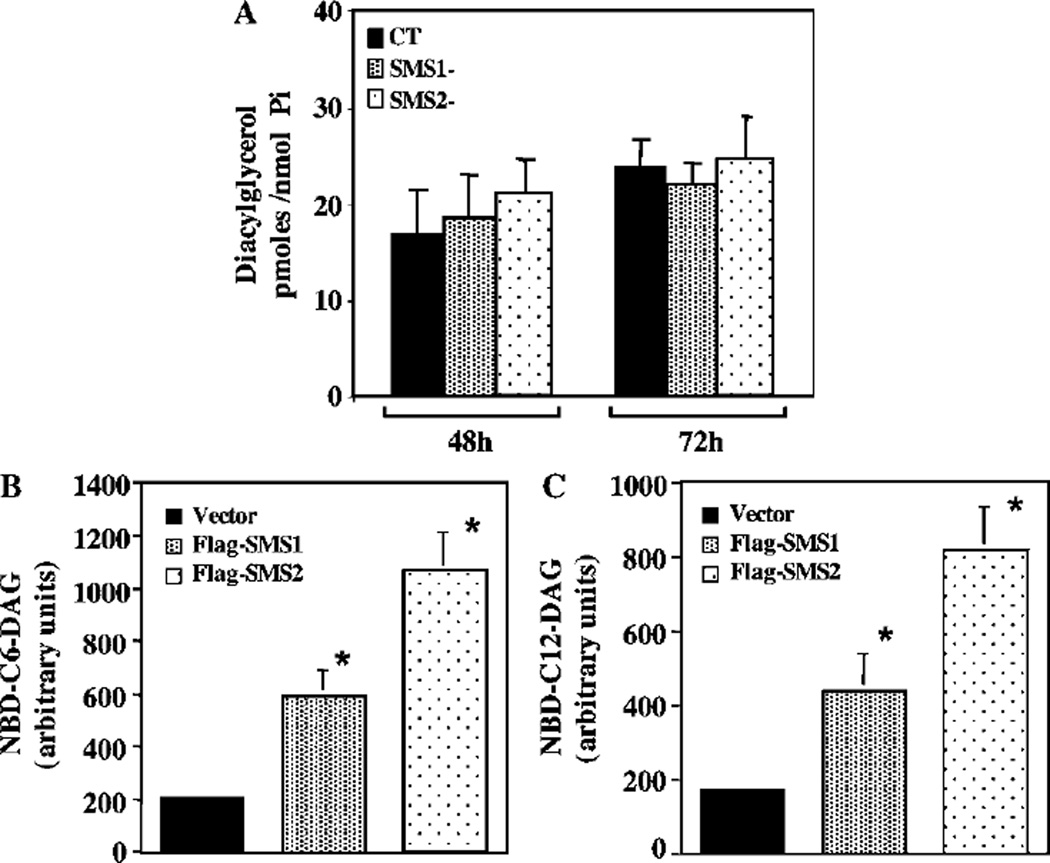
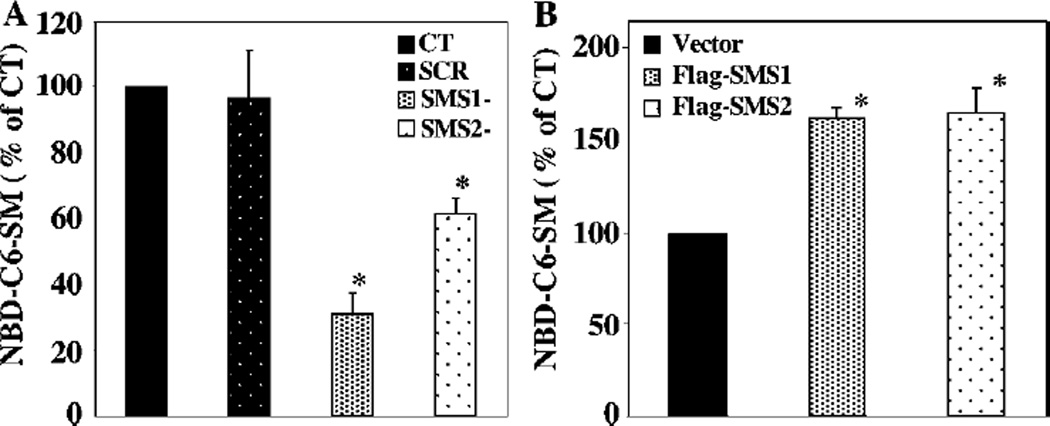
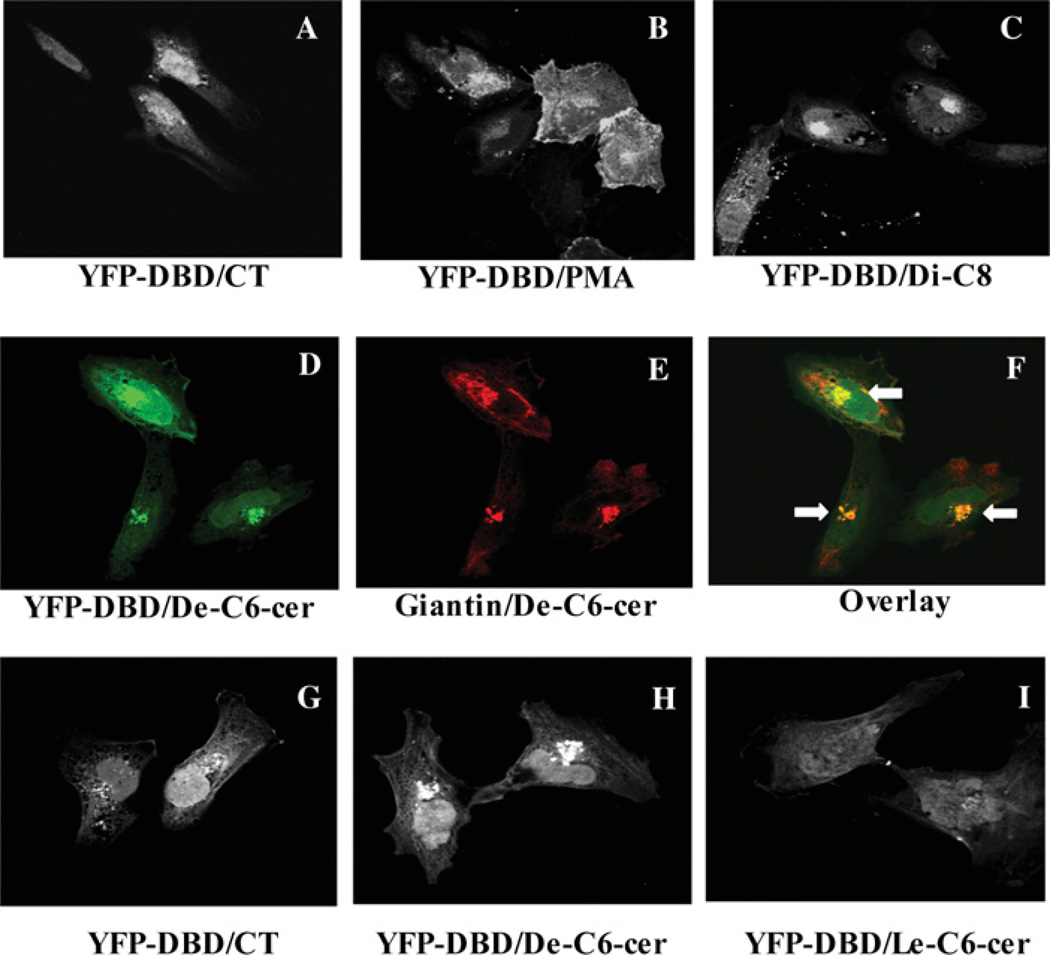
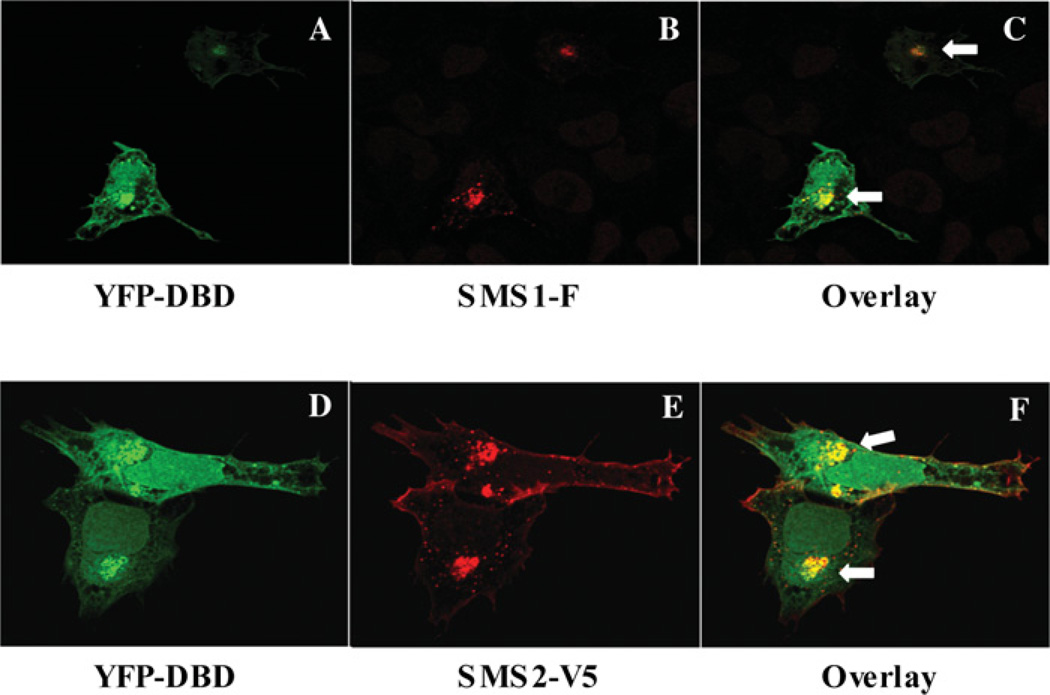
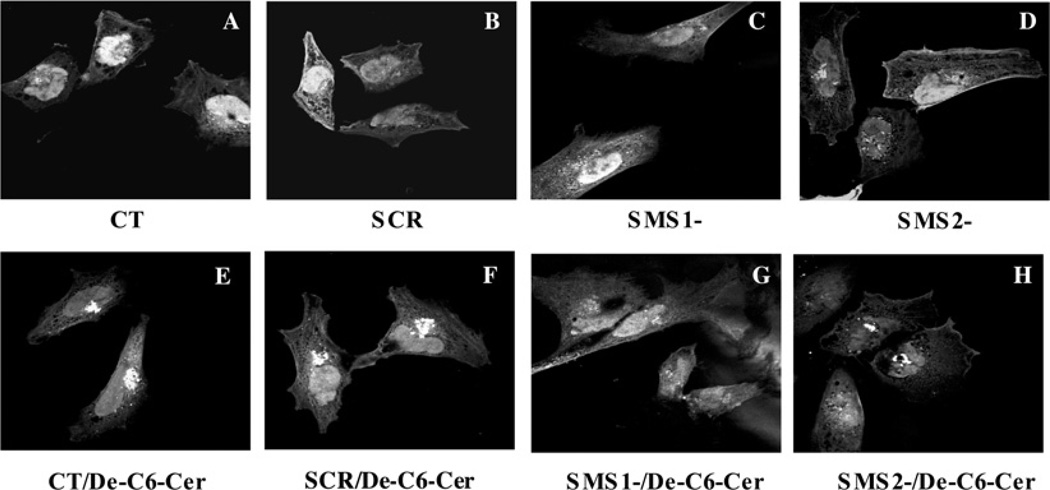
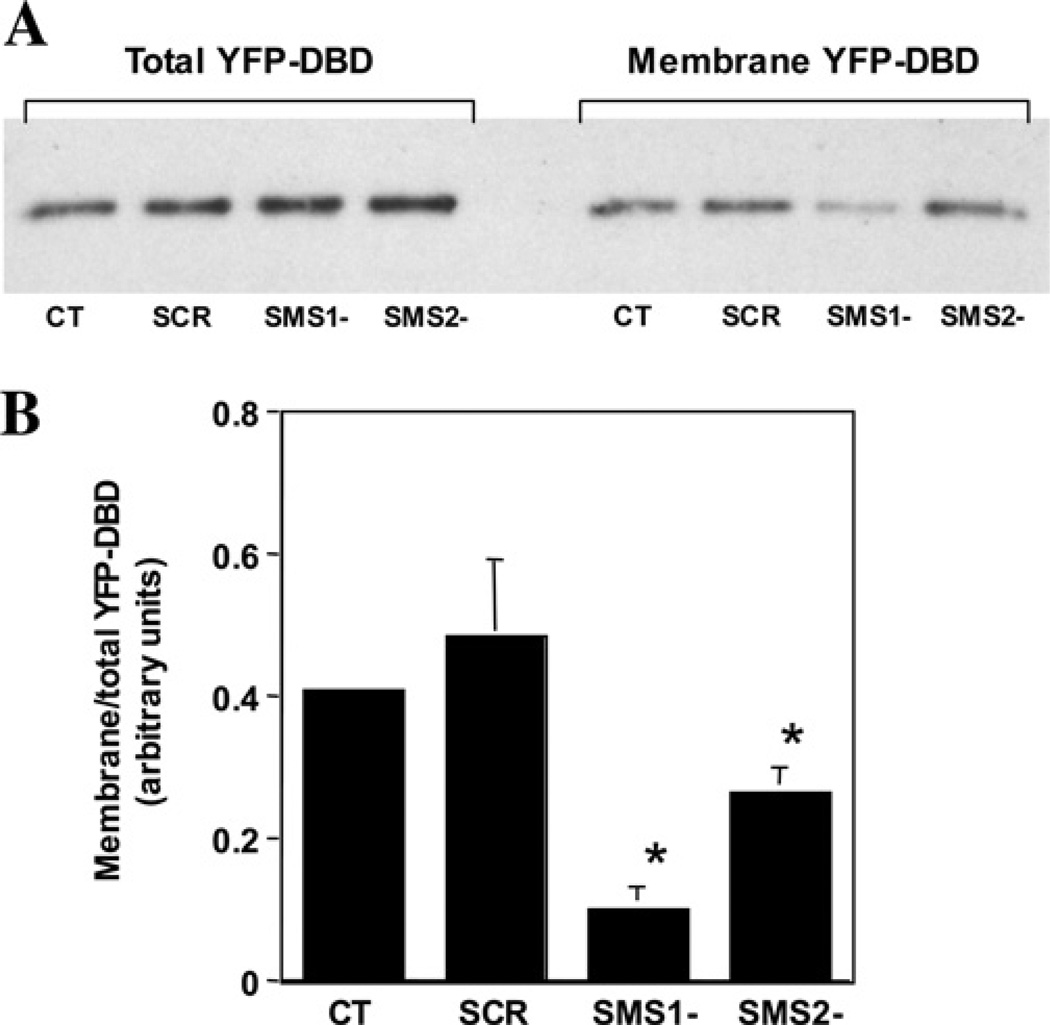
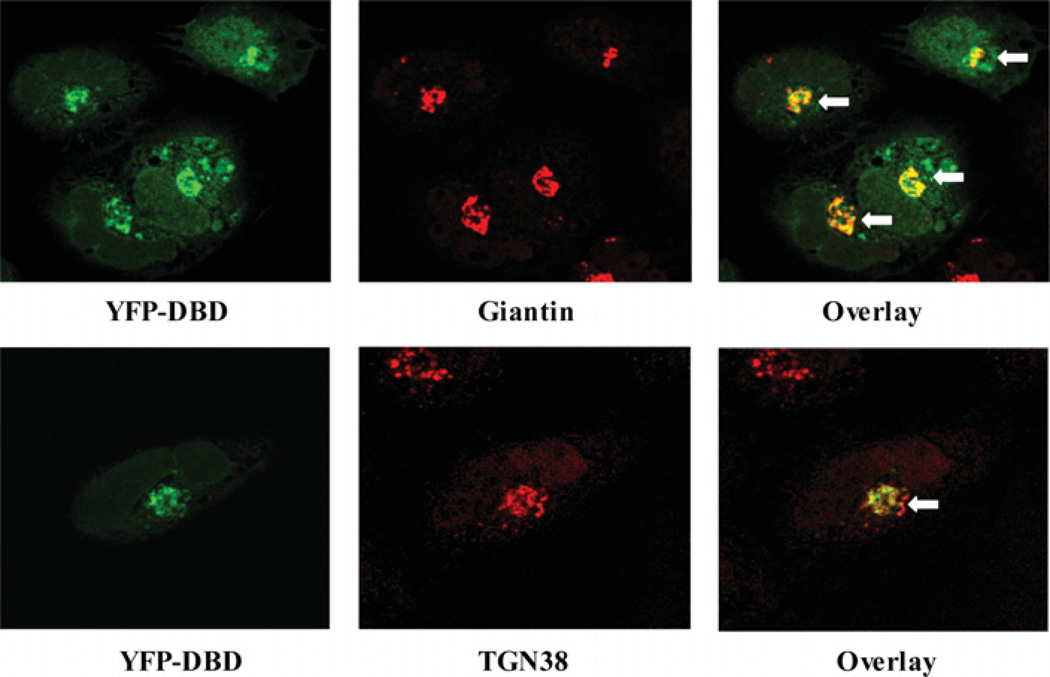
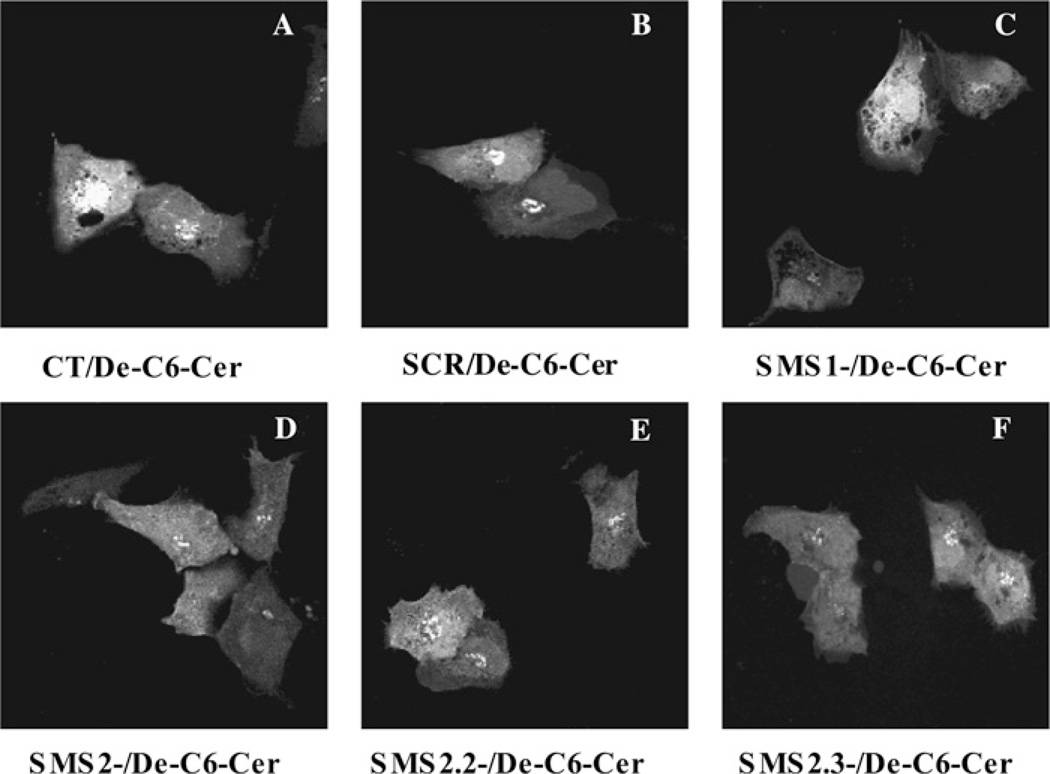
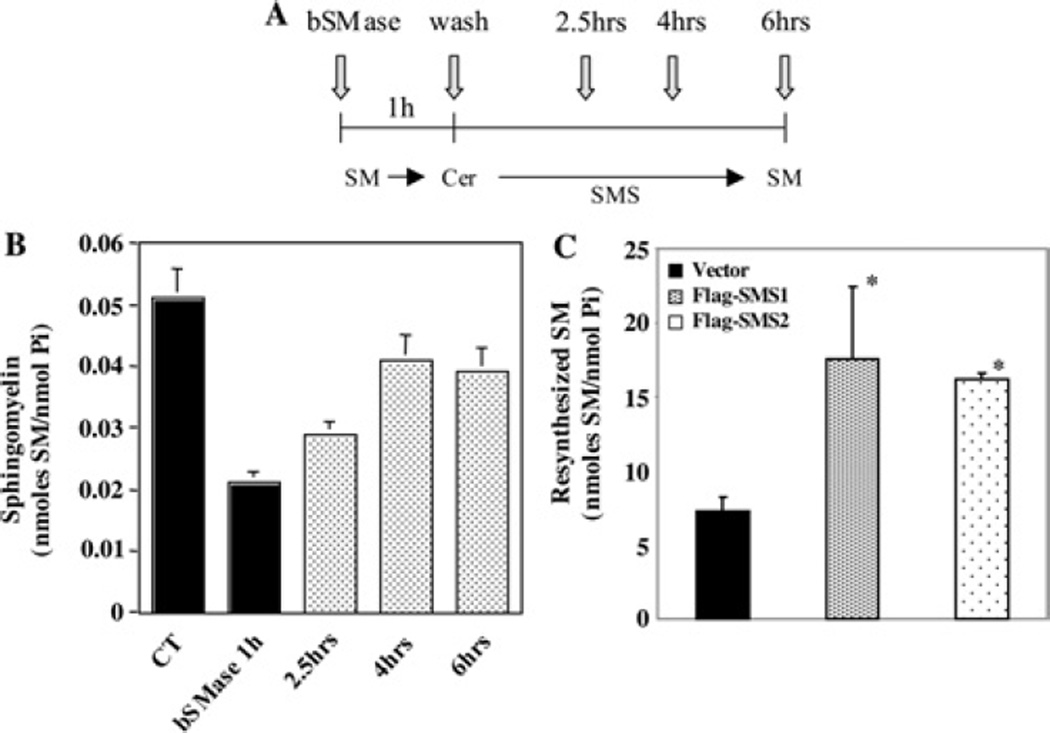
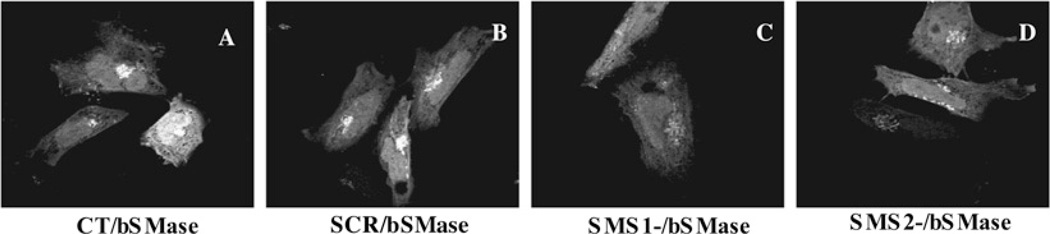
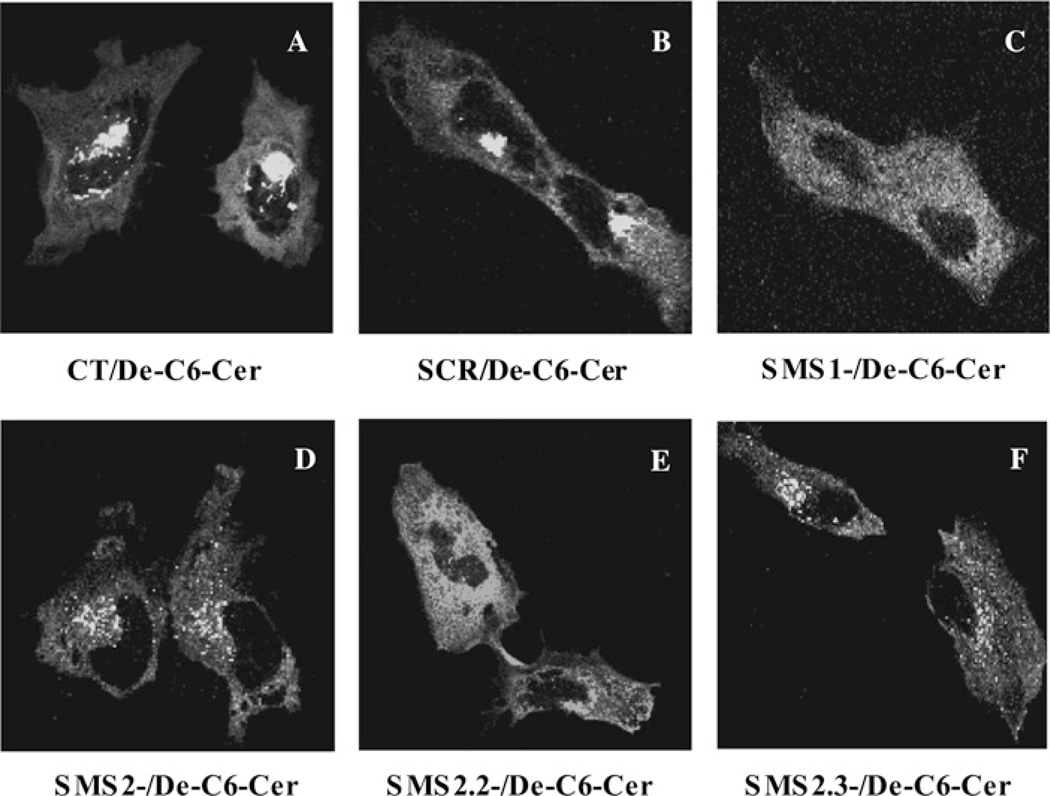
SMS [SM (sphingomyelin) synthase] is a class of enzymes that produces SM by transferring a phosphocholine moiety on to ceramide. PC (phosphatidylcholine) is believed to be the phosphocholine donor of the reaction with consequent production of DAG (diacylglycerol), an important bioactive lipid. In the present study, by modulating SMS1 and SMS2 expression, the role of these enzymes on the elusive regulation of DAG was investigated. Because we found that modulation of SMS1 or SMS2 did not affect total levels of endogenous DAG in resting cells, whereas they produce DAG in vitro, the possibility that SMSs could modulate subcellular pools of DAG, once acute activation of the enzymes is triggered, was investigated. Stimulation of SM synthesis was induced by either treatment with short-chain ceramide analogues or by increasing endogenous ceramide at the plasma membrane, and a fluorescently labelled conventional C1 domain [from PKC (protein kinase C)] enhanced in its DAG binding activity was used to probe subcellular pools of DAG in the cell. With this approach, we found, using confocal microscopy and subcellular fractionation, that modulation of SMS1 and, to a lesser extent, SMS2 affected the formation of DAG at the Golgi apparatus. Similarly, down-regulation of SMS1 and SMS2 reduced the localization of the DAG-binding protein PKD (protein kinase D) to the Golgi. These results provide direct evidence that both enzymes are capable of regulating the formation of DAG in cells, that this pool of DAG is biologically active, and for the first time directly implicate SMS1 and SMS2 as regulators of DAG-binding proteins in the Golgi apparatus.


Figures

Figure 1
Figure 1. SMS1 and SMS2 regulate DAG production in vitro but their downregulation does not affect basal total DAG levels
(A) Cells were treated with siRNA targeting SMS1 (SMS1−) or SMS2 (SMS2−) for 48 or 72 h and then collected for DAG determination by DGK assay. The results shown are the means of two independent experiments performed in duplicate. Error bars represent S.D. (B and C) Cells were transfected with empty vector, FLAG–SMS1 or FLAG–SMS2 for 24 h. Cells were then collected and processed for in vitro SMS enzymatic assay as described in the Experimental section. Fluorescently-labelled short-chain PC analogues (NBD-C6-PC or NBD-C12-PC) were used as substrates. The results shown are the means for three independent experiments. Error bars represent S.D. and *P < 0.05 compared with vector.
Figure 2
Figure 2. Modulation of SMS1 or SMS2 affects cellular metabolism of NBD-C6-ceramide to NBD-C6-SM
(A) HeLa cells were treated with Oligofectamine™ alone (CT), with 10 nM SCR or siRNA targeting SMS1 (SMS1−) or SMS2 (SMS2−) for 48 h. (B) Cells were transfected with empty vector, FLAG–SMS1 or FLAG–SMS2 for 24 h. HeLa cells were then treated with 5 µM NBD-C6-ceramide for 4 h, and total lipids were extracted as described by Bligh and Dyer [24]; equal amount of total phospholipids were loaded on to a TLC plate and lipids were separated in chloroform/methanol/15mM CaCl2 (60:35:8, by vol.). Fluorescent lipids were visualized using a phosphorimager and identified using authentic standards. The results are the means for at least three independent experiments, and error bars represent S.D. and *P < 0.05 compared with Oligofectamine™ alone (A) or vector control (B).
Figure 3
Figure 3. Metabolism of short-chain ceramide induces production of DAG at the Golgi
HeLa cells were transfected with 1 µg of YFP–DBD for 22 h. Then cells were either left untreated (A) and (G) or treated with 20 nM PMA for 30 min (B) or with 10 µM DiC8 (C), with 3 µM d-e-C6-ceramide (D), (E) and (H) or 3 µM l-e-C6-ceramide (I) for 1 h. Cells were fixed, and in (A–C) and (G–I), cells were analysed directly by confocal microscopy using the YFP fluorescence. Confocal images were captured and processed using LSM 510 META. In (D–F), cells were processed for indirect immunofluorescence with anti-giantin (Golgi marker) polyclonal antibodies and stained with anti-rabbit Alexa Fluor® 633-conjugated secondary antibodies (red). Images are representative of at least two independent experiments. Arrows indicate sites of co-localization.
Figure 4
Figure 4. The site of DAG formation from metabolism of short-chain ceramide co-localizes with SMSs at the Golgi
HeLa cells were co-transfected with YFP–DBD (green) and with either pcDNA3.1 carrying SMS1–FLAG (SMS 1-F; A–C) or SMS2-V5 (D–F) for 22 h. Cells were then treated with 3 µM d-e-C6-ceramide for 1 h, fixed and processed for immunofluorescence using monoclonal anti-FLAG (A–C) or anti-V5 (D–F) antibodies and stained with secondary Alexa Fluor® 633-conjugated anti-mouse antibodies (red). Samples were analysed by confocal microscopy. Confocal images were captured and processed using the LSM 510 META. Images are representative of at least two independent experiments. Arrows indicate sites of co-localization.
Figure 5
Figure 5. SMS1 and SMS2 are responsible for production of DAG from the metabolism of short-chain ceramide
HeLa cells were treated with Oligofectamine™ (CT; A and E), 10 nM SCR (B and F), siRNA targeting SMS1 (SMS1−; C and G) or SMS2 (SMS2−; D and H) for 48 h. Cells were then transfected with 1 µg of YFP–DBD for 22 h. Cells were then left untreated (A–D) or treated with 3 µM of d-e-C6-ceramide (D-e-C6-Cer) for 1 h (E–H) and then fixed and analysed by confocal microscopy. Confocal images were captured and processed using the LSM 510 META. The images are representative of at least three independent experiments.
Figure 6
Figure 6. SMS1 and SMS2 modulate the levels of YFP–DBD in the membrane fraction
(A) The levels of total YFP–DBD and its membrane-associated fraction after down-regulation of SMS1 (SMS1−) or SMS2 (SMS2−) and C6-ceramide treatment were determined by Western blotting analysis. (B) Quantification of the ratio between the levels of YFP–DBD associated with the membrane fraction and the total transfected YFP–DBD present in each sample is reported. The Labwork software was used for quantification of the intensity of the bands on the gel. (A) shows a representative experiment. Results from quantification shown in (B) are the means of three independent measurements. Error bars represent S.D. and *P < 0.05 compared with control (CT).
Figure 7
Figure 7. In SV40-transformed WI38 cells, stimulation of SM synthesis induces localization of the YFP–DBD to the Golgi
SV40-transformed WI38 cells transiently overexpressing YFP–DBD were treated with 3 µM C6-ceramide for 1 h. After fixation, indirect immunofluorescence was performed using anti-giantin or anti-TGN38 antibodies. The co-localization of YFP–DBD with both proteins indicates the Golgi localization of YFP–DBD. Confocal images were captured and processed using the LSM 510 META.
Figure 8
Figure 8. SMS1 and SMS2 are responsible for production of DAG from the metabolism of short-chain ceramide in SV40-transformed WI38 fibroblast
SV40-transformed WI38 fibroblasts were treated with Oligofectamine™ (CT) (A), 10 nM SCR (B) or siRNA targeting SMS1 (SMS1−) (C) or SMS2 (SMS2−) (D) for 48 h. Cells were then transfected with 1 µg of YFP–DBD for 22 h. Cells were then treated with 3 µM d-e-C6-ceramide (De-C6-Cer) for 1 h and then fixed and analysed by confocal microscopy. Confocal images were captured and processed using the LSM 510 META. (E) and (F) Cells were treated with 5 nM of two additional siRNA sequences targeting SMS2 [5 nM of SMS2.2− or SMS2.3− were found to cause maximal down-regulation of SMS2 as determined by RT–PCR (reverse transcription–PCR)]. The images are representative of two independent experiments.
Figure 9
Figure 9. Both SMS1 and SMS2 regulate SM synthesis from ceramide produced at the plasma membrane
(A) A schematic diagram of the experimental conditions used in (B) and (C). After being exposed to 1 h treatment with 50 mU/ml bSMase, cells were washed thoroughly and incubated for up to 6 h in the absence of bSMase. Cells were collected at the indicated time points and lipid analysis was performed for non-radioactive SM measurements as described in the Experimental section. For (C), after overexpression of FLAG–SMS1 or FLAG–SMS2 for 18 h, HeLa cells were treated with 50 mU/ml of bSMase for 1 h followed by 2.5 h of incubation in the absence of bSMase; cells were then rinsed, collected in ice-cold PBS, and lipid analysis was performed for non-radioactive SM measurements as described in the Experimental section. The values are representative of at least 3 independent experiments, and error bars represent S.D. and *P < 0.05 compared with vector control.
Figure 10
Figure 10. SMS1 and SMS2 are responsible for production of DAG from the metabolism of ceramide generated at the plasma membrane
HeLa cells were treated with Oligofectamine™ (CT) (A), 10 nM SCR (B) or siRNA targeting SMS1 (SMS1−) (C) or SMS2 (SMS2−) (D) for 48 h. Cells were then transfected with 1 µg of YFP–DBD for 22 h. Cells were then treated with bSMase as indicated in Figure 9. After the removal of bSMase, cells were incubated for 3 h, and then fixed and analysed by confocal microscopy. Confocal images were captured and processed using the LSM 510 META. The images are representative of at least three independent experiments.
Figure 11
Figure 11. Stimulation of SM synthesis induces localization of PKD to the Golgi
HeLa cells transiently overexpressing PKD–RFP (red) were either left untreated (A) or treated with 3 µM C6-ceramide for 1 h and then fixed (B–G). For (B–G), indirect immunofluorescence was performed using anti-giantin (C and D) or anti-TGN38 (F and G) antibodies (green). The co-localization of PKD–RFP with giantin and TGN38 (arrows) indicates Golgi localization of PKD–RFP. Confocal images were captured and processed using the LSM 510 META. The images are representative of two independent experiments.
Figure 12
Figure 12. SMS1 and, to a lesser extent, SMS2 regulate localization of PKD to the Golgi in response to stimulation of SM synthesis
HeLa cells were treated with Oligofectamine™ (CT) (A), 10 nM SCR (B) or siRNA targeting SMS1 (SMS1−) (C) or SMS2 (SMS2−) (D) for 48 h. Cells were transfected with 1 µg of PKD–RFP for 22 h. Cells were then treated with 3 µM of d-e-C6-ceramide (De-C6-Cer) for 1 h and then fixed and analysed by confocal microscopy. Confocal images were captured and processed using the LSM 510 META. (E and F) Cells were treated with 5 nM of two additional siRNA sequences targeting SMS2 (SMS2.2− or SMS2.3− respectively). The images are representative of three independent experiments.

Similar articles

Cited by

References

    1. Ullman MDR, Radin N. The enzymatic formation of sphingomyelin from ceramide and lecithin in mouse liver. J. Biol. Chem. 1974;249:1506–1512. - PubMed
    1. Bernert JT, Ullman MD. Biosynthesis of sphingomyelin from erythro-ceramides and phosphatidylcholine by a microsomal cholinephosphoesterase. Biochim. Biophys. Acta. 1981;666:99–109. - PubMed
    1. Marggraf WD, Anderer FA, Kanfer J. The formation of sphingomyelin from phosphatidylcholine in plasma membrane preparations from mouse fibroblasts. Biochim. Biophys. Acta. 1981;664:61–73. - PubMed
    1. Marggraf WD, Zertani R, Anderer FA, Kanfer JN. The role of endogenous phosphatidylcholine and ceramide in the biosynthesis of sphingomyelin in mouse fibroblasts. Biochim. Biophys. Acta. 1982;710:314–323. - PubMed
    1. Voelker DRK, Kennedy EP. Cellular and enzymic synthesis of sphingomyelin. Biochemistry. 1982;21:2753–2759. - PubMed

Publication types

MeSH terms

Substances