. 2008 Apr 9;27(7):970-81.
doi: 10.1038/emboj.2008.59. Epub 2008 Mar 20.

The closure of Pak1-dependent macropinosomes requires the phosphorylation of CtBP1/BARS

Affiliations

The closure of Pak1-dependent macropinosomes requires the phosphorylation of CtBP1/BARS

Prisca Liberali et al. EMBO J. .

Abstract

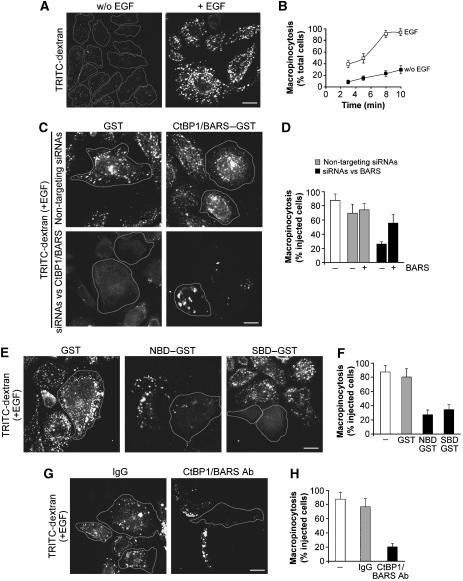
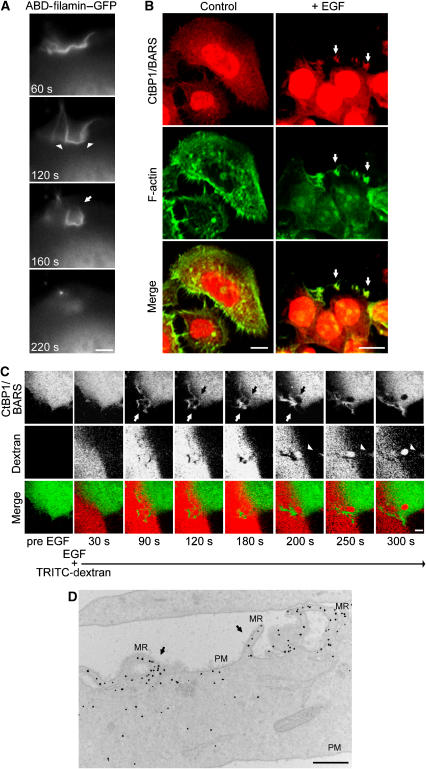
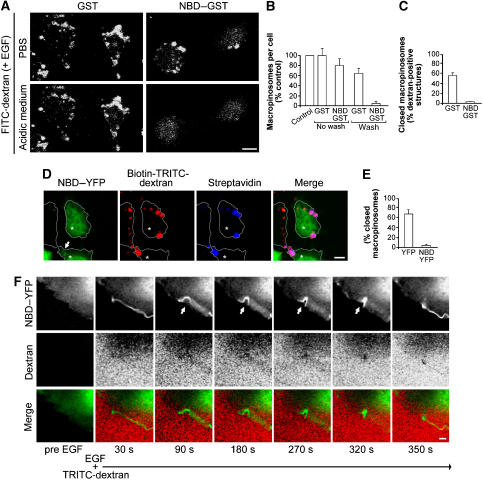
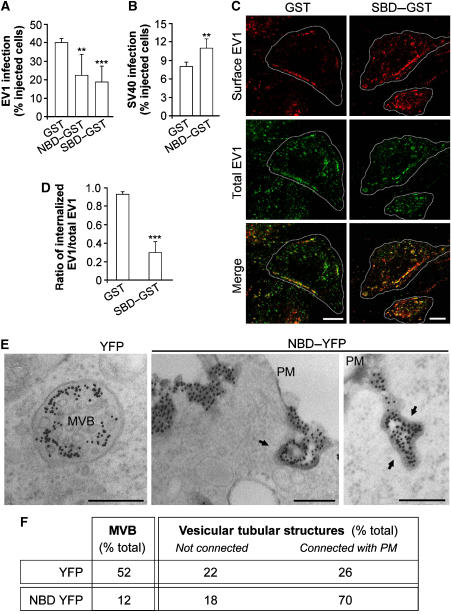
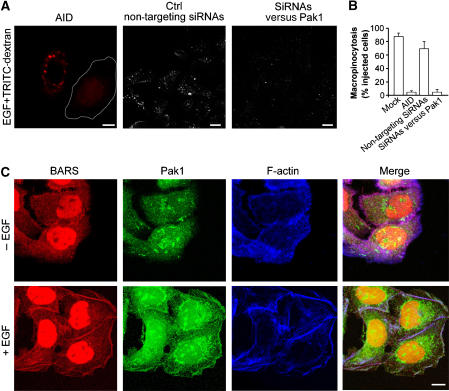
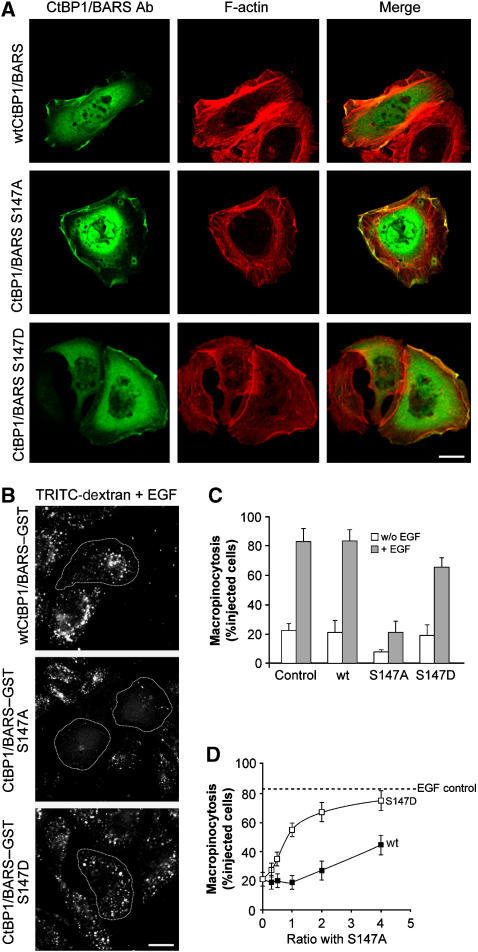
Membrane fission is an essential process in membrane trafficking and other cellular functions. While many fissioning and trafficking steps are mediated by the large GTPase dynamin, some fission events are dynamin independent and involve C-terminal-binding protein-1/brefeldinA-ADP ribosylated substrate (CtBP1/BARS). To gain an insight into the molecular mechanisms of CtBP1/BARS in fission, we have studied the role of this protein in macropinocytosis, a dynamin-independent endocytic pathway that can be synchronously activated by growth factors. Here, we show that upon activation of the epidermal growth factor receptor, CtBP1/BARS is (a) translocated to the macropinocytic cup and its surrounding membrane, (b) required for the fission of the macropinocytic cup and (c) phosphorylated on a specific serine that is a substrate for p21-activated kinase, with this phosphorylation being essential for the fission of the macropinocytic cup. Importantly, we also show that CtBP1/BARS is required for macropinocytic internalization and infection of echovirus 1. These results provide an insight into the molecular mechanisms of CtBP1/BARS activation in membrane fissioning, and extend the relevance of CtBP1/BARS-induced fission to human viral infection.


Figures

Figure 1
Figure 1
CtBP1/BARS is required for EGF-stimulated macropinocytosis in A431 cells. (A) Cells were incubated for 1 h in serum-free Ringer's buffer and for 8 min in Ringer's buffer containing TRITC-conjugated dextran in the absence (w/o) or presence (+) of 50 ng/ml EGF. After fixing, the cells were examined under confocal microscopy for macropinocytosis. (B) Quantification of macropinocytosing cells treated as in (A), as indicated (see Materials and methods). (C) Cells were transfected for 72 h with non-targeting siRNAs or siRNAs targeted to CtBP1/BARS, and injected with GST or wild-type CtBP1-S/BARS–GST, as indicated. One hour later, they were incubated for 1 h in serum-free Ringer's buffer and then for 8 min in Ringer's buffer containing 50 ng/ml EGF and TRITC-conjugated dextran. Injected cells are outlined. (D) Quantification of macropinocytosing cells treated as in (C), as indicated (see Materials and methods). (E) Cells were microinjected with GST, NBD or SBD, as indicated, and processed as in (C). (F) Quantification of macropinocytosing cells treated as in (E), as indicated (see Materials and methods). (G) Cells were either untreated (not shown), or injected with IgG or the blocking p50-2 anti-CtBP1/BARS antibody (CtBP1/BARS Ab), as indicated, and 1 h later they were processed as in (C). (H) Quantification of macropinocytosing cells treated as in (G), as indicated (see Materials and methods). More than 100 cells were analysed under each experimental condition, and the data are means±s.d. from three independent experiments. Scale bars: 10 μm.
Figure 2
Figure 2
Effects of EGF stimulation on CtBP1/BARS localization in A431 cells. (A) Cells were transfected with the actin-binding domain of filamin–GFP (ABD-filamin–GFP), incubated for 1 h in serum-free Ringer's buffer and stimulated with 50 ng/ml EGF. Representative frames of time-lapse imaging for ABD-filamin–GFP are shown. Arrowheads, cup-shaped macropinocytic invaginations; arrow, closing macropinocytic cup. (B) Immunofluorescence analyses of endogenous CtBP1/BARS and F-actin localization in cells incubated for 1 h in serum-free Ringer's buffer and then for 8 min in Ringer's buffer in the absence (control) or presence (+) of 50 ng/ml EGF. The cells were then fixed and stained with the p50-2 anti-CtBP1/BARS antibody (red) and 488-conjugated phalloidin to reveal actin organization (F-actin), as indicated. The merged signals are shown in the lower panels. White arrows, macropinocytic cups seen among plasma membrane ruffles. (C) Cells were transfected with CtBP1-S/BARS–YFP (6 h of overexpression), incubated for 1 h in serum-free Ringer's buffer and stimulated with 50 ng/ml EGF in the presence of TRITC-conjugated dextran. Representative frames of time-lapse imaging for CtBP1-S/BARS–YFP (green) and TRITC-dextran (red) and merged signals are shown, as indicated. Upper panels, 90–200 s: white arrow, closing macropinocytic cup and CtBP1-S/BARS enrichment at the neck; black arrow, disappearance of CtBP1-S/BARS–YFP from the base of the macropinocytic cup. Middle panels, 200–300 s: arrowhead, internalized macropinosome. (D) Immuno-EM analysis of CtBP1-S/BARS–YFP localization in cells prepared and stimulated with 50 ng/ml EGF for 8 min, as in (A). The cells were then fixed, stained with an anti-YFP antibody and prepared for EM (see Materials and methods). MR, membrane ruffles; PM, plasma membrane. Black dots, enrichment of CtBP1-S/BARS–YFP at plasma membrane ruffles (arrows). More than 50 cells were analysed under each experimental condition, in three independent experiments. Scale bars: (A, C) 1 μm; (B) 10 μm; (D) 600 nm.
Figure 3
Figure 3
Characterization of the role of CtBP1/BARS in macropinosome formation in A431 cells. (A) Cells were microinjected with GST or NBD–GST, as indicated, and incubated for 1 h in serum-free Ringer's buffer and for 8 min in Ringer's buffer containing 50 ng/ml EGF and FITC-conjugated dextran. The cells were then fixed without the pre-fixing wash, to detect both fully incorporated macropinosomes and formed macropinocytic cups still connected with the plasma membrane. To distinguish between these, the fixed cells were incubated in PBS at either neutral pH (PBS) or pH 5 (acidic medium), to quench fluorescence of the macropinosomes connected with the plasma membrane. The time frame of our confocal analysis is less than 10 min. (B, C) Quantification of macropinosomes in cells without or with the pre-fixing wash (B) and of closed macropinosomes (C), in cells treated as in (A), as indicated (see Materials and methods). (D) Cells were transfected with NBD–YFP (6 h overexpression) and incubated for 1 h in serum-free Ringer's buffer and for 8 min in Ringer's buffer containing 50 ng/ml EGF and TRITC- and biotin-conjugated dextran. The cells were then fixed without the pre-fixing wash, as indicated in (A). To distinguish between fully incorporated and still connected macropinosomes, the fixed cells were stained (without permeabilization) with streptavidin-633 (to reveal the latter). Arrow, NBD-YFP at the macropinocytic cup. (E) Quantification of closed macropinosomes in cells transfected with YFP or NBD–YFP and treated as in (D). (F) Cells were transfected with NBD–YFP (6 h of overexpression), incubated for 1 h in serum-free Ringer's buffer and then with 50 ng/ml EGF and TRITC-labelled dextran. Representative frames of time-lapse imaging for NBD–YFP (green) and TRITC-dextran (red) and merged signals are shown, as indicated. Upper panels, 90–320 s: arrows, macropinosomes not yet sealed. More than 50 cells were analysed under each experimental condition and the data are means±s.d. from three independent experiments. Scale bars: (A, D) 10 μm; (F) 1 μm.
Figure 4
Figure 4
Effects of CtBP1/BARS inhibition on infection and α2β1-mediated internalization of EV1 in SAOS cells. (A) Cells were microinjected with GST, NBD–GST or SBD–GST, as indicated, incubated with EV1 virus for 6 h and then fixed and quantified for EV1-infected cells (see Materials and methods). (B) As (A), with SV40 virus for 12 h, as indicated, for SV40-infected cells. (C) As (A), with EV1 virus for 2 h, as indicated. Cells were fixed and labelled for surface-bound (red) and total (green) EV1 (with non-permeabilized and permeabilized cells, respectively), with merged signal shown. Green dots in the merged signal represent internalized virus. (D) Quantification of the ratio of internalized to total EV1, as described in (C). More than 100 cells were analysed under each experimental condition, and the data are means±s.e. from three independent experiments. (E) Cells were transfected with empty YFP vector or NBD–YFP for 2 h, as indicated, then incubated for 2 h with an anti-α2-integrin antibody to induce integrin internalization and fixed and prepared for EM. Integrin was revealed with a gold-conjugated secondary antibody, and membranes accessible by extracellular medium were revealed by treatment with ruthenium red (electron-dense membranes). Left-hand panel, multivesicular body (MVB) in control cells. Centre and right-hand panels, integrin-labelled vesicular-tubular structures connected with the plasma membrane (PM). Arrows, electron-dense membranes. (F) Quantification from morphometric analysis of cells treated as in (E), showing per cent distributions of integrin-labelled membranes among the not connected/connected phenotypes, corrected for transfection efficiency (40%). Altogether 700 structures were counted under each condition. Scale bars: (C) 10 μm; (E) 200 nm. **P<0.005, ***P<0.001 (Student's t-test).
Figure 5
Figure 5
Effects of the Pak1 auto-inhibitory domain on EGF-stimulated macropinocytosis and localization of endogenous Pak1 and CtBP1/BARS in A431 cells. (A) Cells were transfected with the Pak1 auto-inhibitory domain (AID) for 12 h or for 48 h with non-targeting siRNAs or siRNAs targeted to Pak1, incubated for 1 h in serum-free Ringer's buffer and then for 8 min in Ringer's buffer with 50 ng/ml EGF and TRITC-conjugated dextran. After fixing, the cells were examined under confocal microscopy for macropinocytosis. (B) Quantification of macropinocytosing cells treated as in (A), as indicated (see Materials and methods). (C) Immunofluorescence analyses of endogenous CtBP1/BARS, Pak1 and F-actin localization. Cells were incubated for 1 h in serum-free Ringer's buffer and for 8 min in Ringer's buffer in the absence (−) or presence (+) of 50 ng/ml EGF. Then the cells were fixed and stained with the p50-2 anti-CtBP1/BARS antibody (BARS; red), an anti-Pak1 antibody (Pak1; green) and 633-conjugated phalloidin, to reveal actin organization (F-actin; blue); the merged signals are also shown. Scale bars: (A, C) 10 μm.
Figure 6
Figure 6
Characterization of Pak1-mediated CtBP1/BARS phosphorylation during macropinocytosis in A431 cells. (A) Immunofluorescence localization of wild-type (wt) CtBP/BARS and its S147A and S147D mutants and F-actin in EGF-stimulated cells. Cells were transfected for 6 h with the indicated CtBP1/BARS constructs, incubated for 1 h in serum-free Ringer's buffer and then for 8 min in Ringer's buffer with 50 ng/ml EGF. The cells were then fixed and stained with the p50-2 anti-CtBP1/BARS antibody (BARS Ab; green) and 546-conjugated phalloidin to reveal actin organization (F-actin; red); the merged signals are also shown. (B) Cells were microinjected with wild-type (wt) CtBP1-S/BARS–GST or its phospho-mimetic (S147D-BARS–GST) and phospho-depleted (S147A-BARS–GST) mutants, incubated for 1 h in serum-free Ringer's buffer and for 8 min in Ringer's buffer containing 50 ng/ml EGF and TRITC-conjugated dextran. (C) Quantification of macropinocytosing cells treated as in (B), as indicated (see Materials and methods). (D) Cells were microinjected with different molar ratios of wild-type CtBP1-S/BARS–GST (wt) or CtBP1-S/BARS-S147D mutant (S147D), both versus CtBP1-S/BARS-S147A, incubated for 1 h in serum-free Ringer's buffer and for 8 min in Ringer's buffer containing 50 ng/ml EGF and TRITC-conjugated dextran. Quantification for macropinocytosing cells was carried out, with more than 100 cells analysed under each experimental condition. Dashed line, EGF-stimulated control macropinocytosis. Data are means±s.d. from three independent experiments. Scale bars: (A, B) 10 μm.

Similar articles

Cited by

References

    1. Ahram M, Sameni M, Qiu RG, Linebaugh B, Kirn D, Sloane BF (2000) Rac1-induced endocytosis is associated with intracellular proteolysis during migration through a three-dimensional matrix. Exp Cell Res 260: 292–303 - PubMed
    1. Amstutz B, Gastaldelli M, Kälin S, Imelli N, Boucke K, Wandeler E, Mercer J, Hemmi S, Greber UF (2008) Subversion of CtBP1-controlled macropinocytosis by human adenovirus serotype 3. EMBO J (submitted), advance online publication 6 March 2008; doi:10.1038/emboj.2008.38 - PMC - PubMed
    1. Amyere M, Mettlen M, Van Der Smissen P, Platek A, Payrastre B, Veithen A, Courtoy PJ (2002) Origin, originality, functions, subversions and molecular signalling of macropinocytosis. Int J Med Microbiol 291: 487–494 - PubMed
    1. Barnes CJ, Vadlamudi RK, Mishra SK, Jacobson RH, Li F, Kumar R (2003) Functional inactivation of a transcriptional corepressor by a signaling kinase. Nat Struct Biol 10: 622–628 - PubMed
    1. Bonazzi M, Spano S, Turacchio G, Cericola C, Valente C, Colanzi A, Kweon HS, Hsu VW, Polishchuck EV, Polishchuck RS, Sallese M, Pulvirenti T, Corda D, Luini A (2005) CtBP3/BARS drives membrane fission in dynamin-independent transport pathways. Nat Cell Biol 7: 570–580 - PubMed

Publication types

MeSH terms

LinkOut - more resources