Genetic analysis of synaptotagmin-7 function in synaptic vesicle exocytosis
- PMID: 18308933
- PMCID: PMC2268828
- DOI: 10.1073/pnas.0712372105
Genetic analysis of synaptotagmin-7 function in synaptic vesicle exocytosis
Abstract
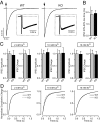
Synaptotagmin-7 is a candidate Ca(2+) sensor for exocytosis that is at least partly localized to synapses. Similar to synaptotagmin-1, which functions as a Ca(2+) sensor for fast synaptic vesicle (SV) exocytosis, synaptotagmin-7 contains C(2)A and C(2)B domains that exhibit Ca(2+)-dependent phospholipid binding. However, synaptotagmin-7 cannot replace synaptotagmin-1 as a Ca(2+) sensor for fast SV exocytosis, raising questions about the physiological significance of its Ca(2+)-binding properties. Here, we examine how synaptotagmin-7 binds Ca(2+) and test whether this Ca(2+) binding regulates Ca(2+)-triggered SV exocytosis. We show that the synaptotagmin-7 C(2)A domain exhibits a Ca(2+)-binding mode similar to that of the synaptotagmin-1 C(2)A domain, suggesting that the synaptotagmin-1 and -7 C(2) domains generally employ comparable Ca(2+)-binding mechanisms. We then generated mutant mice that lack synaptotagmin-7 or contain point mutations inactivating Ca(2+) binding either to both C(2) domains of synaptotagmin-7 or only to its C(2)B domain. Synaptotagmin-7-mutant mice were viable and fertile. Inactivation of Ca(2+) binding to both C(2) domains caused an approximately 70% reduction in synaptotagmin-7 levels, whereas inactivation of Ca(2+) binding to only the C(2)B domain did not alter synaptotagmin-7 levels. The synaptotagmin-7 deletion did not change fast synchronous release, slow asynchronous release, or short-term synaptic plasticity of release of neurotransmitters. Thus, our results show that Ca(2+) binding to the synaptotagmin-7 C(2) domains is physiologically important for stabilizing synaptotagmin-7, but that Ca(2+) binding by synaptotagmin-7 likely does not regulate SV exocytosis, consistent with a role for synaptotagmin-7 in other forms of Ca(2+)-dependent synaptic exocytosis.
Conflict of interest statement
The authors declare no conflict of interest.
Figures


Similar articles
-
Synaptotagmin-7 Is Essential for Ca2+-Triggered Delayed Asynchronous Release But Not for Ca2+-Dependent Vesicle Priming in Retinal Ribbon Synapses.J Neurosci. 2015 Aug 5;35(31):11024-33. doi: 10.1523/JNEUROSCI.0759-15.2015. J Neurosci. 2015. PMID: 26245964 Free PMC article.
-
Allosteric stabilization of calcium and phosphoinositide dual binding engages several synaptotagmins in fast exocytosis.Elife. 2022 Aug 5;11:e74810. doi: 10.7554/eLife.74810. Elife. 2022. PMID: 35929728 Free PMC article.
-
Synaptotagmin-1 and -7 are functionally overlapping Ca2+ sensors for exocytosis in adrenal chromaffin cells.Proc Natl Acad Sci U S A. 2008 Mar 11;105(10):3998-4003. doi: 10.1073/pnas.0712373105. Epub 2008 Feb 28. Proc Natl Acad Sci U S A. 2008. PMID: 18308932 Free PMC article.
-
Fast, synchronous neurotransmitter release: Past, present and future.Neuroscience. 2020 Jul 15;439:22-27. doi: 10.1016/j.neuroscience.2019.04.030. Epub 2019 Apr 29. Neuroscience. 2020. PMID: 31047980 Review.
-
Vesicle dynamics: how synaptic proteins regulate different modes of neurotransmission.J Neurochem. 2013 Jul;126(2):146-54. doi: 10.1111/jnc.12245. Epub 2013 Apr 23. J Neurochem. 2013. PMID: 23517499 Review.
Cited by
-
Delayed onset of hyperglycaemia in a mouse model with impaired glucagon secretion demonstrates that dysregulated glucagon secretion promotes hyperglycaemia and type 2 diabetes.Diabetologia. 2011 Feb;54(2):415-22. doi: 10.1007/s00125-010-1950-2. Epub 2010 Oct 27. Diabetologia. 2011. PMID: 20978738
-
The high-affinity calcium sensor synaptotagmin-7 serves multiple roles in regulated exocytosis.J Gen Physiol. 2018 Jun 4;150(6):783-807. doi: 10.1085/jgp.201711944. Epub 2018 May 24. J Gen Physiol. 2018. PMID: 29794152 Free PMC article. Review.
-
Synaptotagmin 7 Sculpts Short-Term Plasticity at a High Probability Synapse.J Neurosci. 2024 Feb 28;44(9):e1756232023. doi: 10.1523/JNEUROSCI.1756-23.2023. J Neurosci. 2024. PMID: 38262726 Free PMC article.
-
RIM1alpha and RIM1beta are synthesized from distinct promoters of the RIM1 gene to mediate differential but overlapping synaptic functions.J Neurosci. 2008 Dec 10;28(50):13435-47. doi: 10.1523/JNEUROSCI.3235-08.2008. J Neurosci. 2008. PMID: 19074017 Free PMC article.
-
Molecular Mechanisms for the Coupling of Endocytosis to Exocytosis in Neurons.Front Mol Neurosci. 2017 Mar 13;10:47. doi: 10.3389/fnmol.2017.00047. eCollection 2017. Front Mol Neurosci. 2017. PMID: 28348516 Free PMC article. Review.
References
-
- Katz B. The release of neural transmitter substances. Liverpool, England: Liverpool Univ Press; 1969.
-
- Südhof TC. The synaptic vesicle cycle. Annu Rev Neurosci. 2004;27:509–547. - PubMed
-
- Perin MS, Fried VA, Mignery GA, Jahn R, Südhof TC. Phospholipid binding by a synaptic vesicle protein homologous to the regulatory region of protein kinase C. Nature. 1990;345:260–263. - PubMed
-
- Geppert M, et al. Synaptotagmin I: A major Ca2+ sensor for transmitter release at a central synapse. Cell. 1994;79:717–727. - PubMed
Publication types
MeSH terms
Substances
Grants and funding
LinkOut - more resources
Full Text Sources
Other Literature Sources
Molecular Biology Databases
Miscellaneous

