The limits and intensity of Plasmodium falciparum transmission: implications for malaria control and elimination worldwide
- PMID: 18303939
- PMCID: PMC2253602
- DOI: 10.1371/journal.pmed.0050038
The limits and intensity of Plasmodium falciparum transmission: implications for malaria control and elimination worldwide
Abstract
Background: The efficient allocation of financial resources for malaria control using appropriate combinations of interventions requires accurate information on the geographic distribution of malaria risk. An evidence-based description of the global range of Plasmodium falciparum malaria and its endemicity has not been assembled in almost 40 y. This paper aims to define the global geographic distribution of P. falciparum malaria in 2007 and to provide a preliminary description of its transmission intensity within this range.
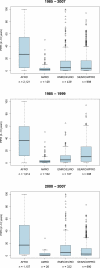
Methods and findings: The global spatial distribution of P. falciparum malaria was generated using nationally reported case-incidence data, medical intelligence, and biological rules of transmission exclusion, using temperature and aridity limits informed by the bionomics of dominant Anopheles vector species. A total of 4,278 spatially unique cross-sectional survey estimates of P. falciparum parasite rates were assembled. Extractions from a population surface showed that 2.37 billion people lived in areas at any risk of P. falciparum transmission in 2007. Globally, almost 1 billion people lived under unstable, or extremely low, malaria risk. Almost all P. falciparum parasite rates above 50% were reported in Africa in a latitude band consistent with the distribution of Anopheles gambiae s.s. Conditions of low parasite prevalence were also common in Africa, however. Outside of Africa, P. falciparum malaria prevalence is largely hypoendemic (less than 10%), with the median below 5% in the areas surveyed.
Conclusions: This new map is a plausible representation of the current extent of P. falciparum risk and the most contemporary summary of the population at risk of P. falciparum malaria within these limits. For 1 billion people at risk of unstable malaria transmission, elimination is epidemiologically feasible, and large areas of Africa are more amenable to control than appreciated previously. The release of this information in the public domain will help focus future resources for P. falciparum malaria control and elimination.
Conflict of interest statement
Figures


Similar articles
-
A world malaria map: Plasmodium falciparum endemicity in 2007.PLoS Med. 2009 Mar 24;6(3):e1000048. doi: 10.1371/journal.pmed.1000048. PLoS Med. 2009. PMID: 19323591 Free PMC article.
-
A new world malaria map: Plasmodium falciparum endemicity in 2010.Malar J. 2011 Dec 20;10:378. doi: 10.1186/1475-2875-10-378. Malar J. 2011. PMID: 22185615 Free PMC article.
-
Human population, urban settlement patterns and their impact on Plasmodium falciparum malaria endemicity.Malar J. 2008 Oct 27;7:218. doi: 10.1186/1475-2875-7-218. Malar J. 2008. PMID: 18954430 Free PMC article.
-
Defining the global spatial limits of malaria transmission in 2005.Adv Parasitol. 2006;62:157-79. doi: 10.1016/S0065-308X(05)62005-2. Adv Parasitol. 2006. PMID: 16647970 Free PMC article. Review.
-
The consequences of reducing transmission of Plasmodium falciparum in Africa.Adv Parasitol. 2002;52:235-64. doi: 10.1016/s0065-308x(02)52013-3. Adv Parasitol. 2002. PMID: 12521262 Review.
Cited by
-
Pathogenicity and virulence of O'nyong-nyong virus: A less studied Togaviridae with pandemic potential.Virulence. 2024 Dec;15(1):2355201. doi: 10.1080/21505594.2024.2355201. Epub 2024 May 26. Virulence. 2024. PMID: 38797948 Free PMC article. Review.
-
Malaria risk mapping among children under five in Togo.Sci Rep. 2024 Apr 8;14(1):8213. doi: 10.1038/s41598-024-58287-1. Sci Rep. 2024. PMID: 38589576 Free PMC article.
-
Pulmonary thromboembolism as a rare complication of Plasmodium vivax malaria: A case report.Clin Case Rep. 2023 Oct 25;11(11):e8106. doi: 10.1002/ccr3.8106. eCollection 2023 Nov. Clin Case Rep. 2023. PMID: 37900711 Free PMC article.
-
Memory CD8+ T cell-mediated protection against liver-stage malaria.Immunol Rev. 2023 Jul;316(1):84-103. doi: 10.1111/imr.13202. Epub 2023 Apr 4. Immunol Rev. 2023. PMID: 37014087 Free PMC article. Review.
-
Global estimates of the number of pregnancies at risk of malaria from 2007 to 2020: a demographic study.Lancet Glob Health. 2023 Jan;11(1):e40-e47. doi: 10.1016/S2214-109X(22)00431-4. Lancet Glob Health. 2023. PMID: 36521951 Free PMC article.
References
-
- Sachs J, Malaney P. The economic and social burden of malaria. Nature. 2002;415:680–685. - PubMed
-
- GFTAM. The Global Fund. Who we are what we do. Geneva: The Global Fund to Fight AIDS, Tuberculosis and Malaria (GFTAM); 2007. 36
-
- Curtis C, Maxwell C, Lemnge M, Kilama WL, Steketee RW, et al. Scaling-up coverage with insecticide-treated nets against malaria in Africa: who should pay. Lancet Infect Dis. 2003;3:304–307. - PubMed
Publication types
MeSH terms
Substances
Grants and funding
LinkOut - more resources
Full Text Sources
Medical

