

Joint space narrowing and Kellgren-Lawrence progression in knee osteoarthritis: an analytic literature synthesis
- PMID: 18280757
- PMCID: PMC2701468
- DOI: 10.1016/j.joca.2007.12.004
Joint space narrowing and Kellgren-Lawrence progression in knee osteoarthritis: an analytic literature synthesis
Abstract
Objective: While the interpretation of cartilage findings on magnetic resonance imaging (MRI) evolves, plain radiography remains the standard method for assessing progression of knee osteoarthritis (OA). We sought to describe factors that explain variability in published estimates of radiographic progression in knee OA.
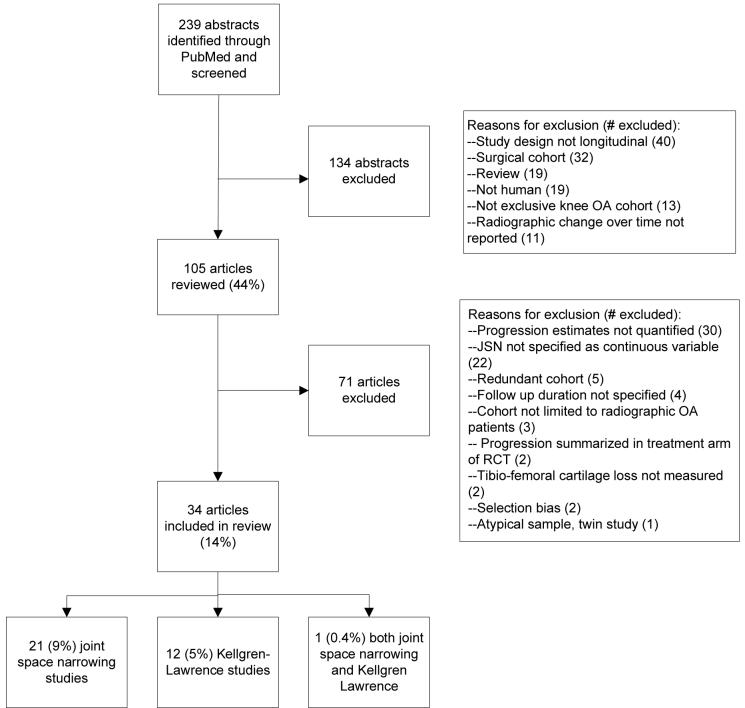
Design: We searched PubMed between January 1985 and October 2006 to identify studies that assessed radiographic progression using either joint space narrowing (JSN) or the Kellgren-Lawrence (K-L) scale. We extracted cohort characteristics [age, gender, and body mass index (BMI)] and technical and other study factors (radiographic approach, study design, OA-related cohort composition). We performed meta-regression analyses of the effects of these variables on both JSN and K-L progression.
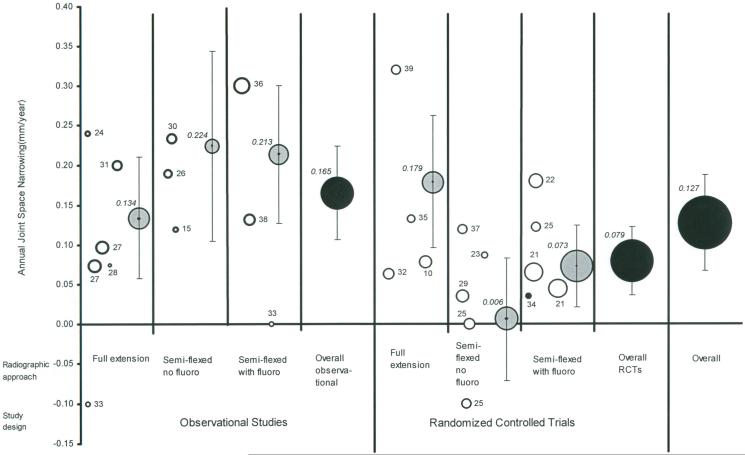
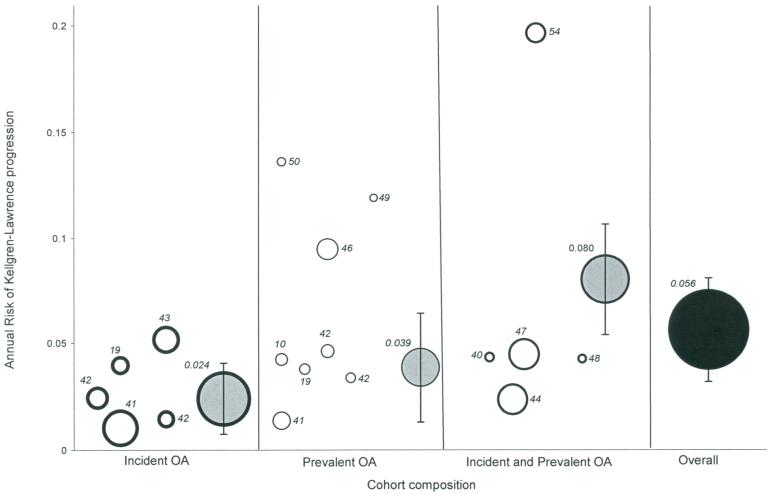
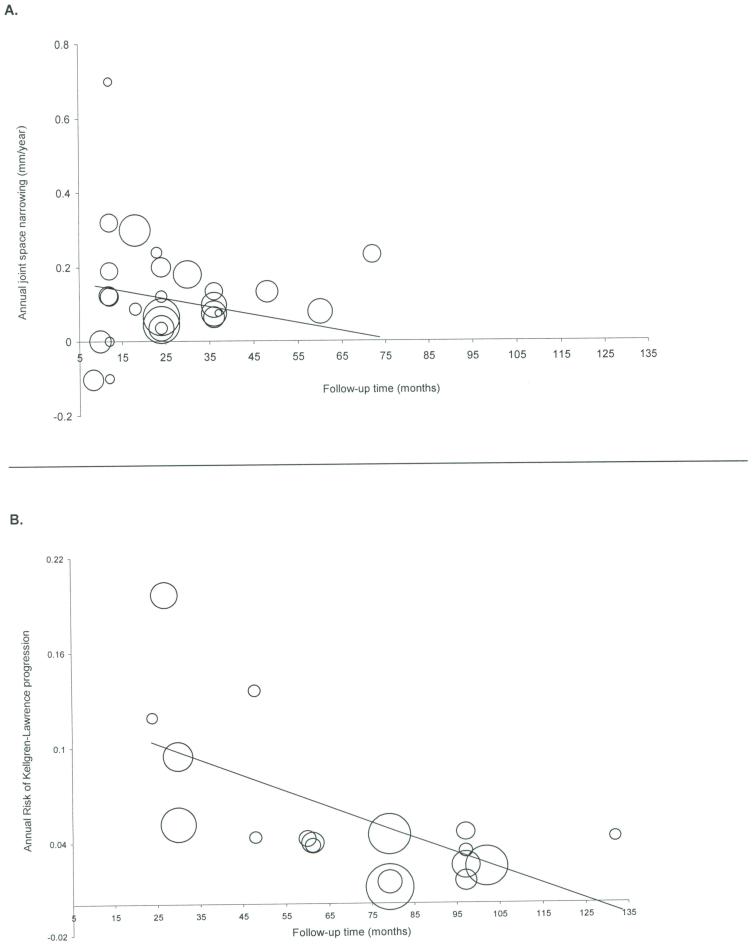
Results: Of 239 manuscripts identified, 34 met inclusion criteria. The mean estimated annual JSN rate was 0.13 +/- 0.15 mm/year. While we found no significant association between JSN and radiographic approach among observational studies, full extension was associated with greater estimated JSN among randomized control trials (RCTs). Overall, observational studies that used the semi-flexed approach reported greater JSN than RCTs that used the same approach. The overall mean risk of K-L progression by at least one grade was 5.6 +/- 4.9%, with higher risk associated with shorter study duration, OA definition (K-L > or = 2 vs K-L > or = 1) and cohorts composed of subjects with both incident and prevalent OA.
Conclusion: While radiographic approach and study design were associated with JSN, OA definition, cohort composition and study duration were associated with risk of K-L progression. These findings may inform the design of disease modifying osteoarthritis drug (DMOAD) trials and assist clinicians in optimal timing of OA treatments.
Figures
Similar articles
-
The longterm outcome of osteoarthritis: rates and predictors of joint space narrowing in symptomatic patients with knee osteoarthritis.J Rheumatol. 2002 Jan;29(1):139-46. J Rheumatol. 2002. PMID: 11824950
-
Severity of joint pain and Kellgren-Lawrence grade at baseline are better predictors of joint space narrowing than bone scintigraphy in obese women with knee osteoarthritis.J Rheumatol. 2005 Aug;32(8):1540-6. J Rheumatol. 2005. PMID: 16078332 Clinical Trial.
-
Progression of cartilage damage and meniscal pathology over 30 months is associated with an increase in radiographic tibiofemoral joint space narrowing in persons with knee OA--the MOST study.Osteoarthritis Cartilage. 2014 Oct;22(10):1743-7. doi: 10.1016/j.joca.2014.07.008. Osteoarthritis Cartilage. 2014. PMID: 25278083 Free PMC article.
-
Recommendations for the use of new methods to assess the efficacy of disease-modifying drugs in the treatment of osteoarthritis.Osteoarthritis Cartilage. 2004 Apr;12(4):263-8. doi: 10.1016/j.joca.2004.01.006. Osteoarthritis Cartilage. 2004. PMID: 15023377 Review.
-
OARSI-OMERACT definition of relevant radiological progression in hip/knee osteoarthritis.Osteoarthritis Cartilage. 2009 Jul;17(7):856-63. doi: 10.1016/j.joca.2009.01.007. Epub 2009 Feb 9. Osteoarthritis Cartilage. 2009. PMID: 19230857 Free PMC article. Review.
Cited by
-
GCT: What happened after 10 years of curettage and cement? Retrospective study of 46 cases.Acta Ortop Bras. 2014;22(6):308-11. doi: 10.1590/1413-78522014220600973. Acta Ortop Bras. 2014. PMID: 25538476 Free PMC article.
-
The incident tibiofemoral osteoarthritis with rapid progression phenotype: development and validation of a prognostic prediction rule.Osteoarthritis Cartilage. 2016 Dec;24(12):2100-2107. doi: 10.1016/j.joca.2016.06.021. Epub 2016 Jul 5. Osteoarthritis Cartilage. 2016. PMID: 27390031 Free PMC article.
-
Classifications in Brief: Kellgren-Lawrence Classification of Osteoarthritis.Clin Orthop Relat Res. 2016 Aug;474(8):1886-93. doi: 10.1007/s11999-016-4732-4. Epub 2016 Feb 12. Clin Orthop Relat Res. 2016. PMID: 26872913 Free PMC article. Review. No abstract available.
-
Bearings in Hip Arthroplasty: Joint Registries vs Precision Medicine: Review Article.HSS J. 2017 Feb;13(1):20-27. doi: 10.1007/s11420-016-9531-7. Epub 2016 Nov 14. HSS J. 2017. PMID: 28167869 Free PMC article. Review.
-
Plasma levels of interleukin-1 receptor antagonist (IL1Ra) predict radiographic progression of symptomatic knee osteoarthritis.Osteoarthritis Cartilage. 2015 Nov;23(11):1915-24. doi: 10.1016/j.joca.2015.08.006. Osteoarthritis Cartilage. 2015. PMID: 26521737 Free PMC article.
References
-
- Handout on Health: Osteoarthritis. [Accessed May 30, 2007]. Available at: www.niams.nih.gov.
-
- D’Ambrosia RD. Epidemiology of osteoarthritis. Orthopedics. 2005 Feb;28(2 Suppl):s201–205. - PubMed
-
- Felson DT, Naimark A, Anderson J, Kazis L, Castelli W, Meenan RF. The prevalence of knee osteoarthritis in the elderly. The Framingham Osteoarthritis Study. Arthritis Rheum. 1987 Aug;30(8):914–918. - PubMed
-
- Altman RD. Structure-/disease-modifying agents for osteoarthritis. Semin Arthritis Rheum. 2005 Jun;34(6 Suppl 2):3–5. - PubMed
-
- Ravaud P, Giraudeau B, Auleley GR, Chastang C, Poiraudeau S, Ayral X, et al. Radiographic assessment of knee osteoarthritis: reproducibility and sensitivity to change. J Rheumatol. 1996 Oct;23(10):1756–1764. - PubMed
Publication types
MeSH terms
Grants and funding
LinkOut - more resources
Full Text Sources
Other Literature Sources
Miscellaneous
