Exchange of GATA factors mediates transitions in looped chromatin organization at a developmentally regulated gene locus
- PMID: 18243117
- PMCID: PMC2254447
- DOI: 10.1016/j.molcel.2007.11.020
Exchange of GATA factors mediates transitions in looped chromatin organization at a developmentally regulated gene locus
Abstract
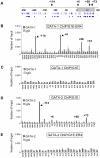
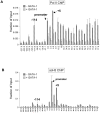
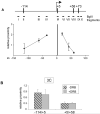
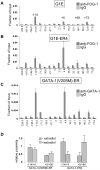
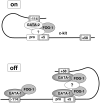
Enhancers can regulate designate promoters over long distances by forming chromatin loops. Whether chromatin loops are lost or reconfigured during gene repression is largely unexplored. We examined the chromosome conformation of the Kit gene that is expressed during early erythropoiesis but is downregulated upon cell maturation. Kit expression is controlled by sequential occupancy of two GATA family transcription factors. In immature cells, a distal enhancer bound by GATA-2 is in physical proximity with the active Kit promoter. Upon cell maturation, GATA-1 displaces GATA-2 and triggers a loss of the enhancer/promoter interaction. Moreover, GATA-1 reciprocally increases the proximity in nuclear space among distinct downstream GATA elements. GATA-1-induced transitions in chromatin conformation are not simply the consequence of transcription inhibition and require the cofactor FOG-1. This work shows that a GATA factor exchange reconfigures higher-order chromatin organization, and suggests that de novo chromatin loop formation is employed by nuclear factors to specify repressive outcomes.
Figures


Comment in
-
Linking differential chromatin loops to transcriptional decisions.Mol Cell. 2008 Feb 1;29(2):154-6. doi: 10.1016/j.molcel.2008.01.008. Mol Cell. 2008. PMID: 18243110
Similar articles
-
Linking differential chromatin loops to transcriptional decisions.Mol Cell. 2008 Feb 1;29(2):154-6. doi: 10.1016/j.molcel.2008.01.008. Mol Cell. 2008. PMID: 18243110
-
Distinct functions of dispersed GATA factor complexes at an endogenous gene locus.Mol Cell Biol. 2006 Oct;26(19):7056-67. doi: 10.1128/MCB.01033-06. Mol Cell Biol. 2006. PMID: 16980610 Free PMC article.
-
GATA-1-mediated transcriptional repression yields persistent transcription factor IIB-chromatin complexes.J Biol Chem. 2006 Dec 8;281(49):37345-52. doi: 10.1074/jbc.M605774200. Epub 2006 Sep 8. J Biol Chem. 2006. PMID: 16963445
-
GATA switches as developmental drivers.J Biol Chem. 2010 Oct 8;285(41):31087-93. doi: 10.1074/jbc.R110.159079. Epub 2010 Jul 29. J Biol Chem. 2010. PMID: 20670937 Free PMC article. Review.
-
GATA-related hematologic disorders.Exp Hematol. 2016 Aug;44(8):696-705. doi: 10.1016/j.exphem.2016.05.010. Epub 2016 May 25. Exp Hematol. 2016. PMID: 27235756 Review.
Cited by
-
Estrogen represses gene expression through reconfiguring chromatin structures.Nucleic Acids Res. 2013 Sep;41(17):8061-71. doi: 10.1093/nar/gkt586. Epub 2013 Jul 1. Nucleic Acids Res. 2013. PMID: 23821662 Free PMC article.
-
Unravelling global genome organization by 3C-seq.Semin Cell Dev Biol. 2012 Apr;23(2):213-21. doi: 10.1016/j.semcdb.2011.11.003. Epub 2011 Nov 18. Semin Cell Dev Biol. 2012. PMID: 22120510 Free PMC article. Review.
-
Mesoscale Modeling Reveals Hierarchical Looping of Chromatin Fibers Near Gene Regulatory Elements.J Phys Chem B. 2016 Aug 25;120(33):8642-53. doi: 10.1021/acs.jpcb.6b03197. Epub 2016 Jun 16. J Phys Chem B. 2016. PMID: 27218881 Free PMC article.
-
Genomic approaches towards finding cis-regulatory modules in animals.Nat Rev Genet. 2012 Jun 18;13(7):469-83. doi: 10.1038/nrg3242. Nat Rev Genet. 2012. PMID: 22705667 Free PMC article. Review.
-
Transcription factor networks in erythroid cell and megakaryocyte development.Blood. 2011 Jul 14;118(2):231-9. doi: 10.1182/blood-2011-04-285981. Epub 2011 May 26. Blood. 2011. PMID: 21622645 Free PMC article. Review.
References
-
- Berrozpe G, Timokhina I, Yukl S, Tajima Y, Ono M, Zelenetz AD, Besmer P. The W(sh), W(57), and Ph Kit expression mutations define tissue-specific control elements located between -23 and -154 kb upstream of Kit. Blood. 1999;94:2658–2666. - PubMed
-
- Broudy VC. Stem cell factor and hematopoiesis. Blood. 1997;90:1345–1364. - PubMed
-
- Cairns LA, Moroni E, Levantini E, Giorgetti A, Klinger FG, Ronzoni S, Tatangelo L, Tiveron C, De Felici M, Dolci S, et al. Kit regulatory elements required for expression in developing hematopoietic and germ cell lineages. Blood. 2003;102:3954–3962. - PubMed
Publication types
MeSH terms
Substances
Grants and funding
LinkOut - more resources
Full Text Sources
Other Literature Sources

