Depolymerization-driven flow in nematode spermatozoa relates crawling speed to size and shape
- PMID: 18227129
- PMCID: PMC2367178
- DOI: 10.1529/biophysj.107.120980
Depolymerization-driven flow in nematode spermatozoa relates crawling speed to size and shape
Abstract
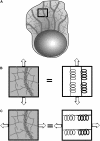
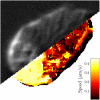
Cell crawling is an inherently physical process that includes protrusion of the leading edge, adhesion to the substrate, and advance of the trailing cell body. Research into advance of the cell body has focused on actomyosin contraction, with cytoskeletal disassembly regarded as incidental, rather than causative; however, extracts from nematode spermatozoa, which use Major Sperm Protein rather than actin, provide at least one example where cytoskeletal disassembly apparently generates force in the absence of molecular motors. To test whether depolymerization can explain force production during nematode sperm crawling, we constructed a mathematical model that simultaneously describes the dynamics of both the cytoskeleton and the cytosol. We also performed corresponding experiments using motile Caenorhabditis elegans spermatozoa. Our experiments reveal that crawling speed is an increasing function of both cell size and anterior-posterior elongation. The quantitative, depolymerization-driven model robustly predicts that cell speed should increase with cell size and yields a cytoskeletal disassembly rate that is consistent with previous measurements. Notably, the model requires anisotropic elasticity, with the cell being stiffer along the direction of motion, to accurately reproduce the dependence of speed on elongation. Our simulations also predict that speed should increase with cytoskeletal anisotropy and disassembly rate.
Figures


Similar articles
-
Localized depolymerization of the major sperm protein cytoskeleton correlates with the forward movement of the cell body in the amoeboid movement of nematode sperm.J Cell Biol. 1999 Sep 6;146(5):1087-96. doi: 10.1083/jcb.146.5.1087. J Cell Biol. 1999. PMID: 10477761 Free PMC article.
-
The geometry and motion of nematode sperm cells.Cell Motil Cytoskeleton. 2009 Jun;66(6):317-27. doi: 10.1002/cm.20362. Cell Motil Cytoskeleton. 2009. PMID: 19396868
-
Larger sperm outcompete smaller sperm in the nematode Caenorhabditis elegans.Proc Biol Sci. 1998 Oct 22;265(1409):1997-2002. doi: 10.1098/rspb.1998.0531. Proc Biol Sci. 1998. PMID: 9821364 Free PMC article.
-
Cytoskeleton dynamics powers nematode sperm motility.Adv Protein Chem. 2005;71:383-99. doi: 10.1016/S0065-3233(04)71010-4. Adv Protein Chem. 2005. PMID: 16230117 Review.
-
Role of major sperm protein (MSP) in the protrusion and retraction of Ascaris sperm.Int Rev Cell Mol Biol. 2012;297:265-93. doi: 10.1016/B978-0-12-394308-8.00007-8. Int Rev Cell Mol Biol. 2012. PMID: 22608562 Review.
Cited by
-
The Moving Boundary Node Method: A level set-based, finite volume algorithm with applications to cell motility.J Comput Phys. 2010 Sep 20;229(19):7287-7308. doi: 10.1016/j.jcp.2010.06.014. J Comput Phys. 2010. PMID: 20689723 Free PMC article.
-
Biochemical mechanisms for regulating protrusion by nematode major sperm protein.Biophys J. 2009 Aug 5;97(3):748-57. doi: 10.1016/j.bpj.2009.05.038. Biophys J. 2009. PMID: 19651033 Free PMC article.
-
Actin-myosin viscoelastic flow in the keratocyte lamellipod.Biophys J. 2009 Oct 7;97(7):1853-63. doi: 10.1016/j.bpj.2009.07.020. Biophys J. 2009. PMID: 19804715 Free PMC article.
-
Sperm morphology and sperm velocity in passerine birds.Proc Biol Sci. 2009 Mar 22;276(1659):1175-81. doi: 10.1098/rspb.2008.1645. Proc Biol Sci. 2009. PMID: 19129098 Free PMC article.
-
Persistent and polarized global actin flow is essential for directionality during cell migration.Nat Cell Biol. 2019 Nov;21(11):1370-1381. doi: 10.1038/s41556-019-0411-5. Epub 2019 Nov 4. Nat Cell Biol. 2019. PMID: 31685997 Free PMC article.
References
-
- Huttenlocher, A., R. R. Sandborg, and A. F. Horwitz. 1995. Adhesion in cell-migration. Curr. Opin. Cell Biol. 7:697–706. - PubMed
-
- Lauffenburger, D., and A. F. Horwitz. 1996. Cell migration: a physically integrated molecular process. Cell. 84:359–369. - PubMed
-
- Mitchison, T. J., and L. P. Cramer. 1996. Actin based cell motility and cell locomotion. Cell. 84:371–379. - PubMed
-
- Rafelski, S. M., and J. A. Theriot. 2004. Crawling toward a unified model of cell motility: spatial and temporal regulation of actin dynamics. Annu. Rev. Biochem. 73:209–239. - PubMed
-
- Rodriguez, O. C., A. W. Schaefer, C. A. Mandato, P. Forscher, W. M. Bement, and C. M. Waterman-Storer. 2003. Conserved microtubule-actin interactions in cell movement and morphogenesis. Nat. Cell Biol. 5:599–609. - PubMed
Publication types
MeSH terms
Grants and funding
LinkOut - more resources
Full Text Sources

