

Tie-dyed2 functions with tie-dyed1 to promote carbohydrate export from maize leaves
- PMID: 18218972
- PMCID: PMC2259043
- DOI: 10.1104/pp.107.111476
Tie-dyed2 functions with tie-dyed1 to promote carbohydrate export from maize leaves
Abstract
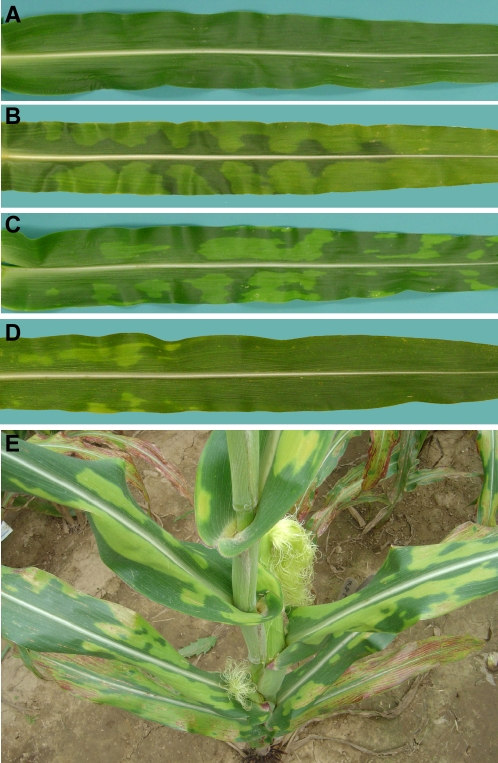
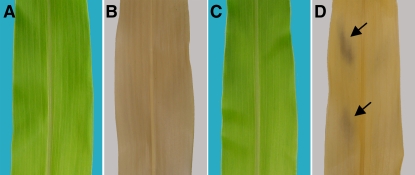
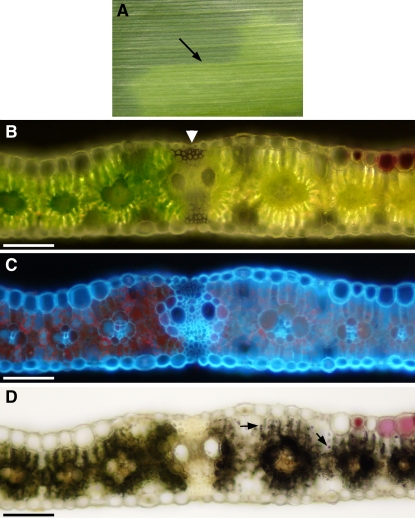
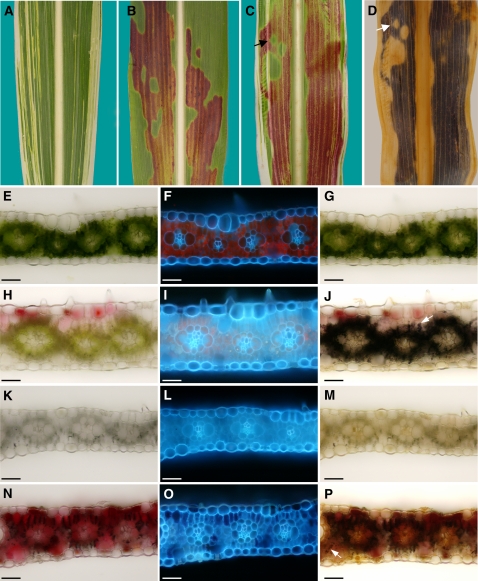
Regulation of carbon partitioning is essential for plant growth and development. To gain insight into genes controlling carbon allocation in leaves, we identified mutants that hyperaccumulate carbohydrates. tie-dyed2 (tdy2) is a recessive mutant of maize (Zea mays) with variegated, nonclonal, chlorotic leaf sectors containing excess starch and soluble sugars. Consistent with a defect in carbon export, we found that a by-product of functional chloroplasts, likely a sugar, induces tdy2 phenotypic expression. Based on the phenotypic similarities between tdy2 and two other maize mutants with leaf carbon accumulation defects, tdy1 and sucrose export defective1 (sxd1), we investigated whether Tdy2 functioned in the same pathway as Tdy1 or Sxd1. Cytological and genetic studies demonstrate that Tdy2 and Sxd1 function independently. However, in tdy1/+; tdy2/+ F(1) plants, we observed a moderate chlorotic sectored phenotype, suggesting that the two genes are dosage sensitive and have a related function. This type of genetic interaction is referred to as second site noncomplementation and has often, though not exclusively, been found in cases where the two encoded proteins physically interact. Moreover, tdy1; tdy2 double mutants display a synergistic interaction supporting this hypothesis. Additionally, we determined that cell walls of chlorotic leaf tissues in tdy mutants contain increased cellulose; thus, tdy mutants potentially represent enhanced feedstocks for biofuels production. From our phenotypic and genetic characterizations, we propose a model whereby TDY1 and TDY2 function together in a single genetic pathway, possibly in homo- and heteromeric complexes, to promote carbon export from leaves.
Figures

Similar articles
-
Tie-dyed2 encodes a callose synthase that functions in vein development and affects symplastic trafficking within the phloem of maize leaves.Plant Physiol. 2012 Nov;160(3):1540-50. doi: 10.1104/pp.112.202473. Epub 2012 Aug 29. Plant Physiol. 2012. PMID: 22932757 Free PMC article.
-
Tie-dyed1 and sucrose export defective1 act independently to promote carbohydrate export from maize leaves.Planta. 2008 Feb;227(3):527-38. doi: 10.1007/s00425-007-0636-6. Epub 2007 Oct 9. Planta. 2008. PMID: 17924136 Free PMC article.
-
tie-dyed1 Functions non-cell autonomously to control carbohydrate accumulation in maize leaves.Plant Physiol. 2007 Jun;144(2):867-78. doi: 10.1104/pp.107.098814. Epub 2007 Apr 13. Plant Physiol. 2007. PMID: 17434986 Free PMC article.
-
tie-dyed1 Regulates carbohydrate accumulation in maize leaves.Plant Physiol. 2006 Dec;142(4):1511-22. doi: 10.1104/pp.106.090381. Epub 2006 Oct 27. Plant Physiol. 2006. PMID: 17071639 Free PMC article.
-
Tie-dyed1 encodes a novel, phloem-expressed transmembrane protein that functions in carbohydrate partitioning.Plant Physiol. 2009 Jan;149(1):181-94. doi: 10.1104/pp.108.130971. Epub 2008 Oct 15. Plant Physiol. 2009. PMID: 18923021 Free PMC article.
Cited by
-
Tie-dyed2 encodes a callose synthase that functions in vein development and affects symplastic trafficking within the phloem of maize leaves.Plant Physiol. 2012 Nov;160(3):1540-50. doi: 10.1104/pp.112.202473. Epub 2012 Aug 29. Plant Physiol. 2012. PMID: 22932757 Free PMC article.
-
Maize Carbohydrate partitioning defective1 impacts carbohydrate distribution, callose accumulation, and phloem function.J Exp Bot. 2018 Jul 18;69(16):3917-3931. doi: 10.1093/jxb/ery203. J Exp Bot. 2018. PMID: 29846660 Free PMC article.
-
Identification and fine mapping of a recessive gene controlling zebra leaf phenotype in maize.Mol Breed. 2021 Jan 22;41(2):9. doi: 10.1007/s11032-021-01202-7. eCollection 2021 Feb. Mol Breed. 2021. PMID: 37309474 Free PMC article.
-
Increased expression of a phloem membrane protein encoded by NHL26 alters phloem export and sugar partitioning in Arabidopsis.Plant Cell. 2013 May;25(5):1689-708. doi: 10.1105/tpc.113.111849. Epub 2013 May 28. Plant Cell. 2013. PMID: 23715470 Free PMC article.
-
Diverse regulation of plasmodesmal architecture facilitates adaptation to phloem translocation.J Exp Bot. 2020 May 9;71(9):2505-2512. doi: 10.1093/jxb/erz567. J Exp Bot. 2020. PMID: 31872215 Free PMC article. Review.
References
-
- Badano JL, Katsanis N (2002) Beyond Mendel: an evolving view of human genetic disease transmission. Nat Rev Genet 3 779–789 - PubMed
-
- Barriere Y, Ralph J, Mechin V, Guillaumie S, Grabber J, Argillier O, Chabbert B, Lapierre C (2004) Genetic and molecular basis of grass cell wall biosynthesis and degradability. II. Lessons from brown-midrib mutants. C R Biol 327 847–860 - PubMed
-
- Beckett JB (1994) Locating recessive genes to chromosome arm with B-A translocations. In M Freeling, V Walbot, eds, The Maize Handbook. Springer-Verlag, New York, pp 315–327
-
- Botha CEJ, Cross RHM, van Bel AJE, Peter CI (2000) Phloem loading in the sucrose-export-defective (SXD-1) mutant maize is limited by callose deposition at plasmodesmata in bundle sheath-vascular parenchyma interface. Protoplasma 214 65–72
Publication types
MeSH terms
Substances
LinkOut - more resources
Full Text Sources
Miscellaneous
