The kinetics of the hydrogen/deuterium exchange of epidermal growth factor receptor ligands
- PMID: 18199660
- PMCID: PMC2367206
- DOI: 10.1529/biophysj.107.125856
The kinetics of the hydrogen/deuterium exchange of epidermal growth factor receptor ligands
Abstract
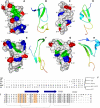
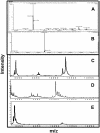
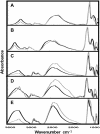
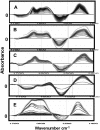
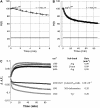
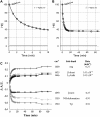
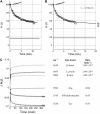
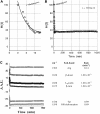
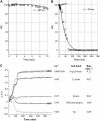
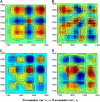
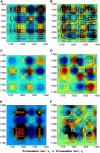
Five highly homologous epidermal growth factor receptor ligands were studied by mass spectral analysis, hydrogen/deuterium (H/D) exchange via attenuated total reflectance Fourier transform-infrared spectroscopy, and two-dimensional correlation analysis. These studies were performed to determine the order of events during the exchange process, the extent of H/D exchange, and associated kinetics of exchange for a comparative analysis of these ligands. Furthermore, the secondary structure composition of amphiregulin (AR) and heparin-binding-epidermal growth factor (HB-EGF) was determined. All ligands were found to have similar contributions of 3(10)-helix and random coil with varying contributions of beta-sheets and beta-turns. The extent of exchange was 40%, 65%, 55%, 65%, and 98% for EGF, transforming growth factor-alpha (TGF-alpha), AR, HB-EGF, and epiregulin (ER), respectively. The rate constants were determined and classified as fast, intermediate, and slow: for EGF the 0.20 min(-1) (Tyr), 0.09 min(-1) (Arg, beta-turns), and 1.88 x 10(-3) min(-1) (beta-sheets and 3(10)-helix); and for TGF-alpha 0.91 min(-1) (Tyr), 0.27 min(-1) (Arg, beta-turns), and 1.41 x 10(-4) min(-1) (beta-sheets). The time constants for AR 0.47 min(-1) (Tyr), 0.04 min(-1) (Arg), and 1.00 x 10(-4) min(-1) (buried 3(10)-helix, beta-turns, and beta-sheets); for HB-EGF 0.89 min(-1) (Tyr), 0.14 min(-1) (Arg and 3(10)-helix), and 1.00 x 10(-3) min(-1) (buried 3(10)-helix, beta-sheets, and beta-turns); and for epiregulin 0.16 min(-1) (Tyr), 0.03 min(-1) (Arg), and 1.00 x 10(-4) min(-1) (3(10)-helix and beta-sheets). These results provide essential information toward understanding secondary structure, H/D exchange kinetics, and solvation of these epidermal growth factor receptor ligands in their unbound state.
Figures
Similar articles
-
Kinetics of gas-phase hydrogen/deuterium exchange and gas-phase structure of protonated phenylalanine, proline, tyrosine and tryptophan.Rapid Commun Mass Spectrom. 2003;17(24):2769-72. doi: 10.1002/rcm.1261. Rapid Commun Mass Spectrom. 2003. PMID: 14673825
-
Amphiregulin is coordinately expressed with heparin-binding epidermal growth factor-like growth factor in the interstitial smooth muscle of the human prostate.Endocrinology. 1999 Dec;140(12):5866-75. doi: 10.1210/endo.140.12.7221. Endocrinology. 1999. PMID: 10579352
-
Hydrogen-deuterium exchange in bovine serum albumin protein monitored by Fourier transform infrared spectroscopy, part II: kinetic studies.Appl Spectrosc. 2005 Nov;59(11):1357-64. doi: 10.1366/000370205774783287. Appl Spectrosc. 2005. PMID: 16316513
-
A subclass of HER1 ligands are prognostic markers for survival in bladder cancer patients.Cancer Res. 2001 Aug 15;61(16):6227-33. Cancer Res. 2001. PMID: 11507076
-
Measuring the hydrogen/deuterium exchange of proteins at high spatial resolution by mass spectrometry: overcoming gas-phase hydrogen/deuterium scrambling.Acc Chem Res. 2014 Oct 21;47(10):3018-27. doi: 10.1021/ar500194w. Epub 2014 Aug 29. Acc Chem Res. 2014. PMID: 25171396 Review.
Cited by
-
ATR-FTIR Biosensors for Antibody Detection and Analysis.Int J Mol Sci. 2022 Oct 7;23(19):11895. doi: 10.3390/ijms231911895. Int J Mol Sci. 2022. PMID: 36233197 Free PMC article.
-
Evaluation of protein secondary structure from FTIR spectra improved after partial deuteration.Eur Biophys J. 2021 May;50(3-4):613-628. doi: 10.1007/s00249-021-01502-y. Epub 2021 Feb 3. Eur Biophys J. 2021. PMID: 33534058 Free PMC article.
-
Protein Microarrays for High Throughput Hydrogen/Deuterium Exchange Monitored by FTIR Imaging.Int J Mol Sci. 2024 Sep 16;25(18):9989. doi: 10.3390/ijms25189989. Int J Mol Sci. 2024. PMID: 39337477 Free PMC article.
References
-
- Riese, D. J., and D. F. Stern. 1998. Specificity within the EGF family/ErbB receptor family signaling network. Bioessays. 20:41–48. - PubMed
-
- Garrett, T. P., N. M. Mckern, M. Lou, T. C. Elleman, T. E. Adams, G. O. Lovrecz, H. J. Zhu, F. Walker, M. J. Frenkel, P. A. Hoyne, R. N. Jorissen, E. C. Nice, A. W. Burgess, and C. W. Ward. 2002. Crystal structure of a truncated epidermal growth factor receptor extracellular domain bound to transforming growth factor α. Cell. 110:763–773. - PubMed
-
- Ogiso, H., R. Ishitani, O. Nureki, S. Fukai, M. Yamanaka, J. H. Kim, K. Saito, A. Sakamoto, M. Inoue, M. Shirouzu, and S. Yokoyama. 2002. Crystal structure of the complex of human epidermal growth factor and receptor extracellular domains. Cell. 110:775–787. - PubMed
-
- Burgess, A. W., H. S. Cho, C. Eigenbrot, K. M. Ferguson, T. P. Garrett, D. J. Leahy, M. A. Lemmon, M. X. Sliwkowski, C. W. Ward, and S. Yokoyama. 2003. An open-and-shut case? Recent insights into the activation of EGF/ErbB receptors. Mol. Cell. 12:541–552. - PubMed
Publication types
MeSH terms
Substances
Grants and funding
LinkOut - more resources
Full Text Sources
Research Materials
Miscellaneous

