

Chemotaxis in Escherichia coli: a molecular model for robust precise adaptation
- PMID: 18179279
- PMCID: PMC2174977
- DOI: 10.1371/journal.pcbi.0040001
Chemotaxis in Escherichia coli: a molecular model for robust precise adaptation
Abstract
The chemotaxis system in the bacterium Escherichia coli is remarkably sensitive to small relative changes in the concentrations of multiple chemical signals over a broad range of ambient concentrations. Interactions among receptors are crucial to this sensitivity as is precise adaptation, the return of chemoreceptor activity to prestimulus levels in a constant chemoeffector environment. Precise adaptation relies on methylation and demethylation of chemoreceptors by the enzymes CheR and CheB, respectively. Experiments indicate that when transiently bound to one receptor, these enzymes act on small assistance neighborhoods (AN) of five to seven receptor homodimers. In this paper, we model a strongly coupled complex of receptors including dynamic CheR and CheB acting on ANs. The model yields sensitive response and precise adaptation over several orders of magnitude of attractant concentrations and accounts for different responses to aspartate and serine. Within the model, we explore how the precision of adaptation is limited by small AN size as well as by CheR and CheB kinetics (including dwell times, saturation, and kinetic differences among modification sites) and how these kinetics contribute to noise in complex activity. The robustness of our dynamic model for precise adaptation is demonstrated by randomly varying biochemical parameters.
Conflict of interest statement
Figures
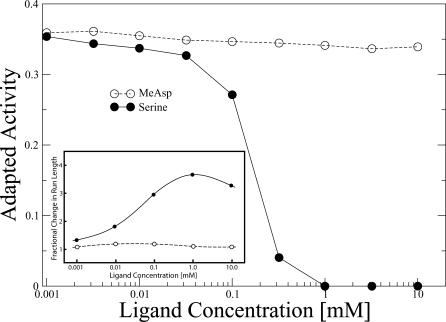
 = 0.06 mM (dot-dashed curve) and
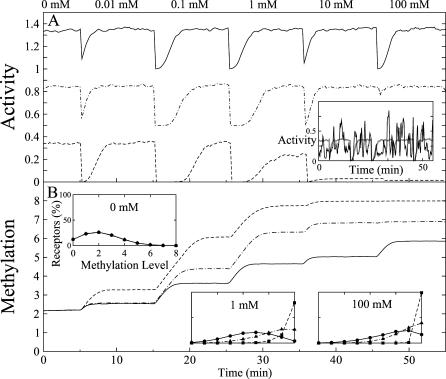
  = 0.02 mM (dashed curve). Other parameters are given in the Model section. Simulations were averaged over 500 runs. (A) Averaged response of complex activity A (Equation 3). Upper curves are each displaced vertically by 0.4. Inset: response curve for one simulation of a single mixed complex. The average activity is superimposed in gray. (B) Averaged methylation m of receptor homodimers. Insets: distribution of methylation levels at 0 mM, 1 mM, and 100 mM.
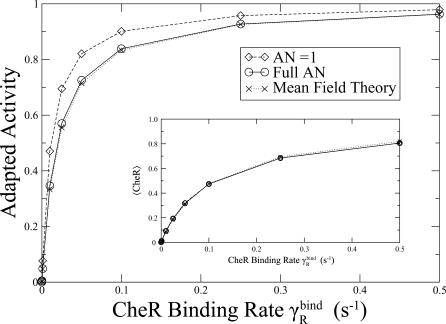
 and
and  . Inset: 〈CheR〉 (proportion of receptors bound to CheR) as a function of CheR binding rate.
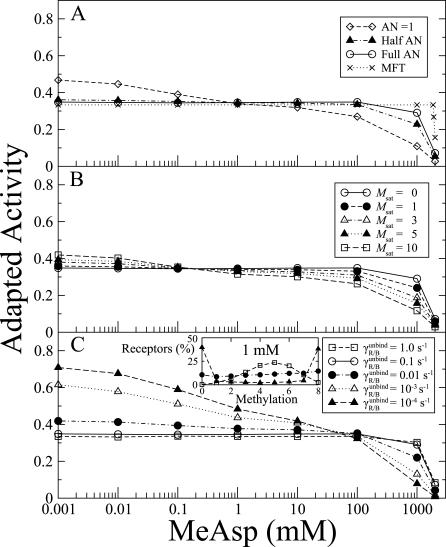
 was kept constant at 10. Inset: distribution of receptor methylation levels at 1 mM MeAsp for
  , and
, and  10−4 s−1.
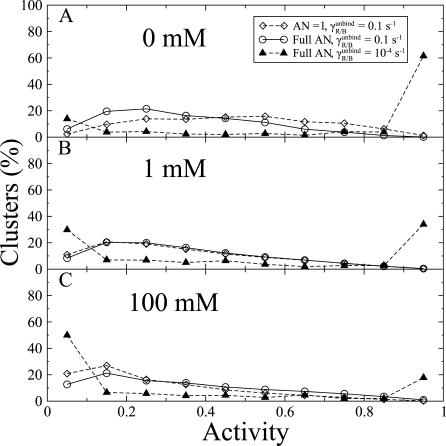
 , and for full AN at
  . The ratio
  was kept constant at 10.
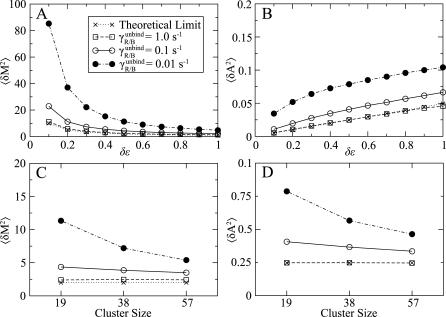
 , and 0.01 s−1, as well as for the theoretical limit from the linear noise approximation (see Model). (A,C) Variance in complex methylation level as a function of the free-energy step δɛ per methyl group (A) and complex size (C) (see Methods). (B, D) Variance in complex activity level as a function of δɛ (C) and complex size (D).
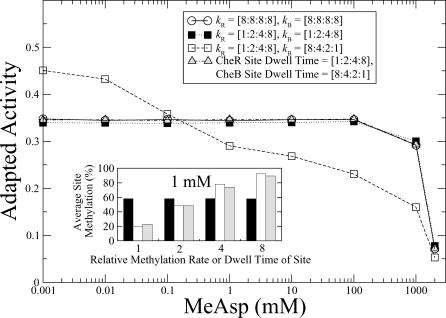
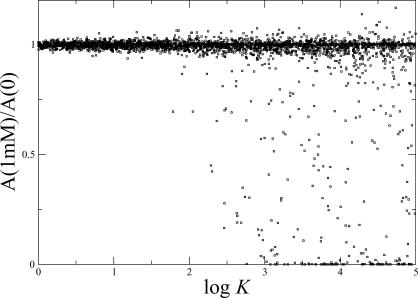
 (see Methods). The scatter plot shows results for 3,000 different parameter sets.
Similar articles
-
Precise adaptation in bacterial chemotaxis through "assistance neighborhoods".Proc Natl Acad Sci U S A. 2006 Aug 29;103(35):13040-4. doi: 10.1073/pnas.0603101103. Epub 2006 Aug 21. Proc Natl Acad Sci U S A. 2006. PMID: 16924119 Free PMC article.
-
Robustness in bacterial chemotaxis.Nature. 1999 Jan 14;397(6715):168-71. doi: 10.1038/16483. Nature. 1999. PMID: 9923680
-
The carboxyl-terminal linker is important for chemoreceptor function.Mol Microbiol. 2006 Apr;60(2):469-79. doi: 10.1111/j.1365-2958.2006.05108.x. Mol Microbiol. 2006. PMID: 16573695
-
Overview of mathematical approaches used to model bacterial chemotaxis I: the single cell.Bull Math Biol. 2008 Aug;70(6):1525-69. doi: 10.1007/s11538-008-9321-6. Epub 2008 Jul 19. Bull Math Biol. 2008. PMID: 18642048 Review.
-
Modelling the bacterial chemotaxis receptor complex.Novartis Found Symp. 2002;247:162-77; discussion 177-81, 198-206, 244-52. Novartis Found Symp. 2002. PMID: 12539955 Review.
Cited by
-
Chemotactic response and adaptation dynamics in Escherichia coli.PLoS Comput Biol. 2010 May 20;6(5):e1000784. doi: 10.1371/journal.pcbi.1000784. PLoS Comput Biol. 2010. PMID: 20502674 Free PMC article.
-
A flagellar accessory protein links chemotaxis to surface sensing.bioRxiv [Preprint]. 2024 Jun 20:2024.06.20.599946. doi: 10.1101/2024.06.20.599946. bioRxiv. 2024. Update in: J Bacteriol. 2024 Nov 21;206(11):e0040424. doi: 10.1128/jb.00404-24. PMID: 38948737 Free PMC article. Updated. Preprint.
-
Combinatorial Control through Allostery.J Phys Chem B. 2019 Apr 4;123(13):2792-2800. doi: 10.1021/acs.jpcb.8b12517. Epub 2019 Mar 4. J Phys Chem B. 2019. PMID: 30768906 Free PMC article.
-
Understanding dynamics using sensitivity analysis: caveat and solution.BMC Syst Biol. 2011 Mar 15;5:41. doi: 10.1186/1752-0509-5-41. BMC Syst Biol. 2011. PMID: 21406095 Free PMC article.
-
Molecular modeling of flexible arm-mediated interactions between bacterial chemoreceptors and their modification enzyme.Protein Sci. 2009 Aug;18(8):1702-14. doi: 10.1002/pro.170. Protein Sci. 2009. PMID: 19606502 Free PMC article.
References
-
- Berg HC. Motile behavior of bacteria. Phys Today. 2000;53:24–29.
-
- Sourjik V. Receptor clustering and signal processing in E. coli chemotaxis. Trends Microbiol. 2004;12:569–576. - PubMed
-
- Bourret RB, Stock AM. Molecular information processing: lessons from bacterial chemotaxis. J Biol Chem. 2002;277:9625–9628. - PubMed
-
- Kim KK, Yokota H, Kim SH. Four-helical-bundle structure of the cytoplasmic domain of a serine chemotaxis receptor. Nature. 1999;400:787–792. - PubMed
Publication types
MeSH terms
Substances
LinkOut - more resources
Full Text Sources
