. 2008 Mar;82(6):3031-44.
doi: 10.1128/JVI.02033-07. Epub 2007 Dec 26.

NKG2D receptor signaling enhances cytolytic activity by virus-specific CD8+ T cells: evidence for a protective role in virus-induced encephalitis

Affiliations

NKG2D receptor signaling enhances cytolytic activity by virus-specific CD8+ T cells: evidence for a protective role in virus-induced encephalitis

Kevin B Walsh et al. J Virol. 2008 Mar.

Abstract

Inoculation with the neurotropic JHM strain of mouse hepatitis virus (JHMV) into the central nervous system (CNS) of mice results in an acute encephalitis associated with an immune-mediated demyelinating disease. During acute disease, infiltrating CD8(+) T cells secrete gamma interferon (IFN-gamma) that controls replication in oligodendrocytes, while infected astrocytes and microglia are susceptible to perforin-mediated lysis. The present study was undertaken to reveal the functional contributions of the activating NKG2D receptor in host defense and disease following JHMV infection. NKG2D ligands RAE-1, MULT1, and H60 were expressed within the CNS following JHMV infection. The immunophenotyping of infiltrating cells revealed that NKG2D was expressed on approximately 90% of infiltrating CD8(+) T cells during acute and chronic disease. Blocking NKG2D following JHMV infection resulted in increased mortality that correlated with increased viral titers within the CNS. Anti-NKG2D treatment did not alter T-cell infiltration into the CNS or the generation of virus-specific CD8(+) T cells, and the expression of IFN-gamma was not affected. However, cytotoxic T-lymphocyte (CTL) activity was dependent on NKG2D expression, because anti-NKG2D treatment resulted in a dramatic reduction in lytic activity by virus-specific CD8(+) T cells. Blocking NKG2D during chronic disease did not affect either T-cell or macrophage infiltration or the severity of demyelination, indicating that NKG2D does not contribute to virus-induced demyelination. These findings demonstrate a functional role for NKG2D in host defense during acute viral encephalitis by selectively enhancing CTL activity by infiltrating virus-specific CD8(+) T cells.


Figures

FIG. 1.
FIG. 1.
NKG2D ligands and the receptor are expressed following JHMV infection. (A) Viral titers within the brains of BALB/c mice infected i.c. with JHMV. Titers within the brains of individual mice are represented by circles, and the average titer for each time point is indicated by the dark line. Data presented are representative of two separate experiments. The sensitivity of the titer assay is ∼100 PFU/g tissue. (B) Transcripts specific for NKG2D ligands were up-regulated compared to levels for sham-infected mice at all time points assayed, as determined by quantitative real-time PCR. Data presented are representative of two separate experiments with a minimum of three mice for each time point.
FIG. 2.
FIG. 2.
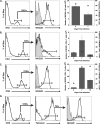
NKG2D expression on cells infiltrating into the CNS of JHMV-infected mice. BALB/c mice were infected i.c. with JHMV, and NKG2D expression on infiltrating cells was determined at select times p.i. NK cells (A), CD4+ T cells (B), and CD8+ T cells (C) were found to express various levels of NKG2D at different times p.i. with virus. Representative histograms (left graphs in panels A to C) are from individual mice at day 7 p.i. For histograms in panels A to C, the shaded area represents isotype-matched control antibody staining and clear areas represent staining with the indicated antibody. In addition, both the overall numbers (gray bars; left y axis) and frequency (black diamonds; right y axis) of NKG2D-positive cells at defined times p.i. are provided (right graphs, panels A to C). (D) NKG2D expression on N318-326 epitope virus-specific CD8+ T cells (determined by tetramer staining) also was defined, with ∼95% of cells at day 12 p.i. expressing NKG2D. Flow cytometric data shown are from a representative experiment of two independent experiments with no fewer than three mice per time point. Data are presented as averages ± SEM.
FIG. 3.
FIG. 3.
NKG2D neutralization in JHMV-infected SCID mice does not affect survival. (A) Quantitative real-time PCR of brain mRNA demonstrated that levels of transcripts for NKG2D ligands are increased in SCID mice compared to those of sham-infected mice at days 3 and 5 p.i. (B) Treatment of SCID mice with anti-NKG2D did not affect host survival compared to that of mice treated with control antibody. Data are presented as averages from two independent experiments with no fewer than six mice per group. (C) Levels of viral recovery from the brains of mice treated with anti-NKG2D or rat IgG were equivalent at all time points assayed. The viral burden is presented from a representative experiment of two independent experiments with three mice per group per time point. Circles represent individual mice, while bars represent the averages of the treatment group.
FIG. 4.
FIG. 4.
Anti-NKG2D treatment in immunocompetent BALB/c mice reduces host survival and antiviral activity. (A) NKG2D neutralization significantly (*, P ≤ 0.05) decreased survival, with only ∼65% of mice surviving at day 12 p.i. In contrast, ∼95% of mice treated with control antibody survived to day 12 p.i. Data are presented as averages from seven independent experiments with no fewer than four mice per group. (B) Analysis of viral titers from the brains of infected mice treated with either rat IgG or anti-NKG2D revealed no significant differences at days 3 and 7 p.i. However, blocking NKG2D resulted in greater (*, P ≤ 0.005) viral burden within the brain at day 11 p.i. than that of control-treated mice. The viral burden is presented from a representative experiment of two independent experiments with no fewer than three mice per group per time point. Circles represent individual mice; bars represent group averages. (C) Immunophenotyping of cellular infiltrates revealed that NK cell infiltration was unaffected by NKG2D neutralization at days 3 and 7 p.i. compared to that of rat IgG treatment. At day 12 p.i., there was a significant decrease (*, P ≤ 0.05) in the number of NK cells present within the brain. (D) Macrophage infiltration was significantly reduced (*, P ≤ 0.05) in anti-NKG2D-treated mice at day 3 p.i. but was similar to that of control-treated mice at days 7 and 12 p.i. Analysis of T-cell infiltration determined that numbers of CD4+ (E) and CD8+ (F) T cells are equivalent in mice treated with either rat IgG or anti-NKG2D. (G) Intracellular IFN-γ staining in response to N318-326 peptide revealed that the infiltration of virus-specific CD8+ T cells was unaffected by NKG2D neutralization compared to that of control-treated mice. (H) N318-326 MHC class I tetramer staining at day 7 p.i. also demonstrated that anti-NKG2D treatment does not affect virus-specific CD8+ T-cell infiltration into the CNS. Cell infiltration data shown in panels C to H are representative of two independent experiments with a minimum of five mice per group. Data are presented as averages ± SEM.
FIG. 5.
FIG. 5.
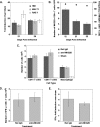
NKG2D receptor signaling does not affect IFN-γ secretion in immunocompetent BALB/c mice. IFN-γ secretion within the brain was determined by MHC class II expression on microglia. (A) The fluorescence intensity of MHC class II on the surface of microglia was similar between rat IgG- and anti-NKG2D-treated mice at day 7 p.i., as demonstrated by a representative histogram. (B) Quantification of the mean fluorescence intensity (MFI) revealed that the level of MHC class II on microglia was similar at days 3, 7, and 12 p.i. in mice treated with either anti-NKG2D or control antibody. MHC class II expression data are representative of two independent experiments with no fewer than five mice per group. (C) IFN-γ protein amounts were reduced in the brains of anti-NKG2D-treated mice compared to those of rat IgG-treated mice at day 7 p.i.; however, the difference was not significant. There was no difference in the amounts of IFN-γ protein present in the brain at days 3 and 12 p.i. between treatment groups. Data presented are representative of two separate experiments, with each experiment using a minimum of four mice per time point. Data are presented as averages ± SEM. (D) Anti-NKG2D treatment of total brain isolates obtained at day 7 p.i. and pulsed with CD8+ T-cell epitope N318-326 resulted in increased IFN-γ secretion, but the difference was not significant compared to that of mice treated with rat IgG. Cells incubated with nonspecific OVA peptide are included to illustrate background levels of IFN-γ expression under the experimental conditions used. Data presented are representative of two separate experiments with three mice per experimental condition, and results are presented as averages ± SEM.
FIG. 6.
FIG. 6.
NKG2D neutralization diminishes CD8+ T-cell CTL activity. (A) J774A.1 target cells pulsed with N318-326 peptide express RAE-1 on the cell surface. (B) JHMV-infected mice treated with rat IgG or anti-NKG2D were sacrificed at day 7 p.i., and the CTL activity of CD8+ T cells was determined by using N318-326 peptide-pulsed J774A.1 cells as targets. Cocultures of total cell isolates and target cells were incubated in the presence of rat IgG or anti-NKG2D. Anti-NKG2D treatment (circles) resulted in reduced (*, P ≤ 0.05) CD8+ T-cell CTL activity compared to that of rat IgG-treated mice (squares). (C) Removal of anti-NKG2D (diamonds) partially restored CTL activity after 4 h, and this correlated with (D) the return of NKG2D expression on CD8+ T cells as demonstrated by using an antibody specific for NKG2D but recognizing a different epitope (MI-6) than that recognized by the antibody (CX5) used for neutralization. The percentage of lysis of OVA peptide-pulsed target cells (triangles in panels B and C) is included to demonstrate the background levels of CTL activity. Data presented are the averages from three independent experiments using a minimum of seven mice from each experimental group for analysis.
FIG. 7.
FIG. 7.
NKG2D ligands and receptor are expressed in the spinal cords of mice persistently infected with JHMV. (A) Real-time PCR analysis revealed that levels of mRNA transcripts for NKG2D ligands were increased compared to those of sham-infected mice within the spinal cords of mice chronically infected at days 21 and 29 p.i. A minimum of three mice per time point was used for analysis. (B) Greater than 90% of CD8+ T cells (black diamonds; right y axis) retained in the spinal cords of infected mice expressed NKG2D on days 12, 21, and 35 p.i. The number of NKG2D+ CD8+ T cells (gray bars; left y axis) was greatest at day 12 p.i. and decreased at days 21 and 35 p.i. (C) Treatment with anti-NKG2D did not alter the infiltration of T cells or macrophages on day 29 p.i. (D) Anti-NKG2D treatment did not reduce the total number of virus-specific CD8+ T cells on day 32 p.i. as determined by intracellular IFN-γ staining following pulsing with N318-326 peptide, and (E) there were no differences in the overall IFN-γ transcript levels as determined by quantitative real-time PCR analysis on day 29 p.i. Data are presented as the averages ± SEM. Data are representative of two independent experiments with a minimum of three mice per time point.
FIG. 8.
FIG. 8.
Anti-NKG2D treatment does not affect the severity of demyelination in JHMV-infected mice. Representative spinal cord tissue sections from JHMV-infected mice at day 27 p.i. revealed no differences in either the number or the distribution of viral antigen in spinal cords of mice treated with either rat IgG (A) (magnification, ×100) or anti-NKG2D (B) (magnification, ×100). Viral antigen was detected by immunoperoxidase staining by using anti-JHMV MAb J.3.3, and antigen-positive cells were demonstrated by the presence of chromogen (arrows) (28, 90). Representative LFB-stained spinal cord sections from JHMV-infected cells at day 32 p.i. from mice treated with rat IgG (C) (magnification, ×40) or anti-NKG2D (D) (magnification, ×40) revealed no differences in the severity of white-matter damage. Demyelination scores were determined by the analysis of LFB-stained tissues and are provided for treatment groups below each representative image.

Similar articles

Cited by

References

    1. Adami, C., J. Pooley, J. Glomb, E. Stecker, F. Fazal, J. O. Fleming, and S. C. Baker. 1995. Evolution of mouse hepatitis virus (MHV) during chronic infection: quasispecies nature of the persisting MHV RNA. Virology 209337-346. - PMC - PubMed
    1. Agresti, A. 1992. A survey of exact interference for contingency tables. Stat. Sci. 7131-177.
    1. Aloisi, F., F. Ria, and L. Adorini. 2000. Regulation of T-cell responses by CNS antigen-presenting cells: different roles for microglia and astrocytes. Immunol. Today 21141-147. - PubMed
    1. Bergmann, C., M. McMillan, and S. Stohlman. 1993. Characterization of the Ld-restricted cytotoxic T-lymphocyte epitope in the mouse hepatitis virus nucleocapsid protein. J. Virol. 677041-7049. - PMC - PubMed
    1. Bergmann, C. C., J. D. Altman, D. Hinton, and S. A. Stohlman. 1999. Inverted immunodominance and impaired cytolytic function of CD8+ T cells during viral persistence in the central nervous system. J. Immunol. 1633379-3387. - PubMed

Publication types

Substances