Reticulon RTN2B regulates trafficking and function of neuronal glutamate transporter EAAC1
- PMID: 18096700
- PMCID: PMC2581797
- DOI: 10.1074/jbc.M708096200
Reticulon RTN2B regulates trafficking and function of neuronal glutamate transporter EAAC1
Abstract
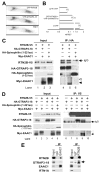
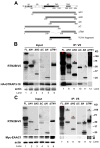
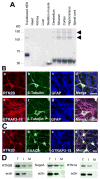
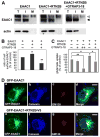
Excitatory amino acid transporters (EAATs) are the primary regulators of extracellular glutamate concentrations in the central nervous system. Their dysfunction may contribute to several neurological diseases. To date, five distinct mammalian glutamate transporters have been cloned. In brain, EAAC1 (excitatory amino acid carrier 1) is the primary neuronal glutamate transporter, localized on the perisynaptic membranes that are near release sites. Despite its potential importance in synaptic actions, little is known concerning the regulation of EAAC1 trafficking from the endoplasmic reticulum (ER) to the cell surface. Previously, we identified an EAAC1-associated protein, GTRAP3-18, an ER protein that prevents ER exit of EAAC1 when induced. Here we show that RTN2B, a member of the reticulon protein family that mainly localizes in the ER and ER exit sites interacts with EAAC1 and GTRAP3-18. EAAC1 and GTRAP3-18 bind to different regions of RTN2B. Each protein can separately and independently form complexes with EAAC1. RTN2B enhances ER exit and the cell surface composition of EAAC1 in heterologous cells. Expression of short interfering RNA-mediated knockdown of RTN2B decreases the EAAC1 protein level in neurons. Overall, our results suggest that RTN2B functions as a positive regulator in the delivery of EAAC1 from the ER to the cell surface. These studies indicate that transporter exit from the ER controlled by the interaction with its ER binding partner represents a critical regulatory step in glutamate transporter trafficking to the cell surface.
Figures


Similar articles
-
The endoplasmic reticulum exit of glutamate transporter is regulated by the inducible mammalian Yip6b/GTRAP3-18 protein.J Biol Chem. 2008 Mar 7;283(10):6175-83. doi: 10.1074/jbc.M701008200. Epub 2007 Dec 31. J Biol Chem. 2008. PMID: 18167356 Free PMC article.
-
Modulation of the neuronal glutamate transporter EAAC1 by the interacting protein GTRAP3-18.Nature. 2001 Mar 1;410(6824):84-8. doi: 10.1038/35065084. Nature. 2001. PMID: 11242046
-
Modulation of the neural glutamate transporter EAAC1 by the addicsin-interacting protein ARL6IP1.J Biol Chem. 2008 Nov 14;283(46):31323-32. doi: 10.1074/jbc.M801570200. Epub 2008 Aug 6. J Biol Chem. 2008. PMID: 18684713
-
Changes in the expression of the glutamate transporter EAAT3/EAAC1 in health and disease.Cell Mol Life Sci. 2014 Jun;71(11):2001-15. doi: 10.1007/s00018-013-1484-0. Epub 2013 Oct 26. Cell Mol Life Sci. 2014. PMID: 24162932 Free PMC article. Review.
-
Neuroprotective properties of the excitatory amino acid carrier 1 (EAAC1).Amino Acids. 2013 Jul;45(1):133-42. doi: 10.1007/s00726-013-1481-5. Epub 2013 Mar 6. Amino Acids. 2013. PMID: 23462929 Review.
Cited by
-
Mutations in the ER-shaping protein reticulon 2 cause the axon-degenerative disorder hereditary spastic paraplegia type 12.J Clin Invest. 2012 Feb;122(2):538-44. doi: 10.1172/JCI60560. Epub 2012 Jan 9. J Clin Invest. 2012. PMID: 22232211 Free PMC article.
-
RTN/Nogo in forming Alzheimer's neuritic plaques.Neurosci Biobehav Rev. 2010 Jul;34(8):1201-6. doi: 10.1016/j.neubiorev.2010.01.017. Epub 2010 Feb 6. Neurosci Biobehav Rev. 2010. PMID: 20144652 Free PMC article.
-
The reverse operation of Na(+)/Cl(-)-coupled neurotransmitter transporters--why amphetamines take two to tango.J Neurochem. 2010 Jan;112(2):340-55. doi: 10.1111/j.1471-4159.2009.06474.x. Epub 2009 Nov 5. J Neurochem. 2010. PMID: 19891736 Free PMC article. Review.
-
Reticulon 4B (Nogo-B) is necessary for macrophage infiltration and tissue repair.Proc Natl Acad Sci U S A. 2009 Oct 13;106(41):17511-6. doi: 10.1073/pnas.0907359106. Epub 2009 Sep 25. Proc Natl Acad Sci U S A. 2009. PMID: 19805174 Free PMC article.
-
Nogo-B is associated with cytoskeletal structures in human monocyte-derived macrophages.BMC Res Notes. 2011 Jan 14;4:6. doi: 10.1186/1756-0500-4-6. BMC Res Notes. 2011. PMID: 21235733 Free PMC article.
References
-
- Fonnum F. J Neurochem. 1984;42:1–11. - PubMed
-
- Dingledine R, Borges K, Bowie D, Traynelis SF. Pharmacol Rev. 1999;51:7–61. - PubMed
-
- Ozawa S, Kamiya K, Tsuzuki K. Prog Neurobiol. 1998;54:581–618. - PubMed
-
- Seal RP, Amara SG. Annu Rev Pharmacol Toxicol. 1999;39:431–456. - PubMed
-
- Maragakis NJ, Rothstein JD. Neurobiol Dis. 2004;15:461–473. - PubMed
Publication types
MeSH terms
Substances
Grants and funding
LinkOut - more resources
Full Text Sources
Molecular Biology Databases

