Neuronal nitric oxide synthase contributes to the regulation of hematopoiesis
- PMID: 18091979
- PMCID: PMC2140250
- DOI: 10.2119/2007-00011.Krasnov
Neuronal nitric oxide synthase contributes to the regulation of hematopoiesis
Abstract
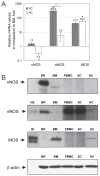
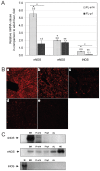
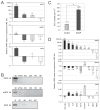
Nitric oxide (NO) signaling is important for the regulation of hematopoiesis. However, the role of individual NO synthase (NOS) isoforms is unclear. Our results indicate that the neuronal NOS isoform (nNOS) regulates hematopoiesis in vitro and in vivo. nNOS is expressed in adult bone marrow and fetal liver and is enriched in stromal cells. There is a strong correlation between expression of nNOS in a panel of stromal cell lines established from bone marrow and fetal liver and the ability of these cell lines to support hematopoietic stem cells; furthermore, NO donor can further increase this ability. The number of colonies generated in vitro from the bone marrow and spleen of nNOS-null mutants is increased relative to wild-type or inducible- or endothelial NOS knockout mice. These results describe a new role for nNOS beyond its action in the brain and muscle and suggest a model where nNOS, expressed in stromal cells, produces NO which acts as a paracrine regulator of hematopoietic stem cells.
Figures


Similar articles
-
Increased longevity of hematopoiesis in continuous bone marrow cultures derived from NOS1 (nNOS, mtNOS) homozygous recombinant negative mice correlates with radioresistance of hematopoietic and marrow stromal cells.Exp Hematol. 2007 Jan;35(1):137-45. doi: 10.1016/j.exphem.2006.09.009. Exp Hematol. 2007. PMID: 17198882
-
Contribution of nitric oxide synthase isoforms to cholinergic vasodilation in murine retinal arterioles.Exp Eye Res. 2013 Apr;109:60-6. doi: 10.1016/j.exer.2013.01.012. Epub 2013 Feb 19. Exp Eye Res. 2013. PMID: 23434456
-
Statin treatment upregulates vascular neuronal nitric oxide synthase through Akt/NF-kappaB pathway.Arterioscler Thromb Vasc Biol. 2007 Jan;27(1):92-8. doi: 10.1161/01.ATV.0000251615.61858.33. Epub 2006 Nov 2. Arterioscler Thromb Vasc Biol. 2007. PMID: 17082483
-
NOS isoform-specific regulation of basal but not exercise-induced mitochondrial biogenesis in mouse skeletal muscle.J Physiol. 2007 Nov 15;585(Pt 1):253-62. doi: 10.1113/jphysiol.2007.141309. Epub 2007 Oct 4. J Physiol. 2007. PMID: 17916611 Free PMC article.
-
Genetic analysis of NOS isoforms using nNOS and eNOS knockout animals.Prog Brain Res. 1998;118:13-25. doi: 10.1016/s0079-6123(08)63197-0. Prog Brain Res. 1998. PMID: 9932431 Review.
Cited by
-
Biomechanical force in blood development: extrinsic physical cues drive pro-hematopoietic signaling.Differentiation. 2013 Oct;86(3):92-103. doi: 10.1016/j.diff.2013.06.004. Epub 2013 Jul 12. Differentiation. 2013. PMID: 23850217 Free PMC article. Review.
-
Nitrergic response to cyclophosphamide treatment in blood and bone marrow.Open Biochem J. 2008;2:81-90. doi: 10.2174/1874091X00802010081. Epub 2008 Jun 3. Open Biochem J. 2008. PMID: 18949079 Free PMC article.
-
Changes in the Proteasome Pool during Malignant Transformation of Mouse Liver Cells.Acta Naturae. 2010 Apr;2(1):102-8. Acta Naturae. 2010. PMID: 22649635 Free PMC article.
-
Co-expression of endothelial and neuronal nitric oxide synthases in the developing vasculatures of the human fetal eye.Graefes Arch Clin Exp Ophthalmol. 2012 Jun;250(6):839-48. doi: 10.1007/s00417-012-1969-9. Epub 2012 Mar 14. Graefes Arch Clin Exp Ophthalmol. 2012. PMID: 22411126 Free PMC article.
-
Regulation of long-term repopulating hematopoietic stem cells by EPCR/PAR1 signaling.Ann N Y Acad Sci. 2016 Apr;1370(1):65-81. doi: 10.1111/nyas.13013. Epub 2016 Mar 1. Ann N Y Acad Sci. 2016. PMID: 26928241 Free PMC article. Review.
References
-
- Bogdan C. Nitric oxide and the regulation of gene expression. Trends Cell Biol. 2001;11:66–75. - PubMed
-
- Contestabile A, Ciani E. Role of nitric oxide in the regulation of neuronal proliferation, survival and differentiation. Neurochem Int. 2004;45:903–14. - PubMed
-
- Enikolopov G, Banerji J, Kuzin B. Nitric oxide and Drosophila development. Cell Death Differ. 1999;6:956–63. - PubMed
-
- Gibbs SM. Regulation of neuronal proliferation and differentiation by nitric oxide. Mol Neurobiol. 2003;27:107–20. - PubMed
-
- Ignarro LJ. Nitric Oxide: Biology and Pathobiology. Academic Press; San Diego: 2000.
Publication types
MeSH terms
Substances
LinkOut - more resources
Full Text Sources

