

Aspects of statin prescribing in Norwegian counties with high, average and low statin consumption - an individual-level prescription database study
- PMID: 18053228
- PMCID: PMC2234392
- DOI: 10.1186/1472-6904-7-14
Aspects of statin prescribing in Norwegian counties with high, average and low statin consumption - an individual-level prescription database study
Abstract
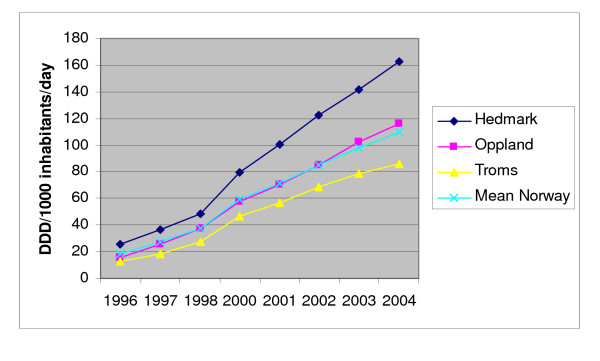
Background: A previous study has shown that variations in threshold and intensity (lipid goal attainment) of statins for primary prevention contribute to regional differences in overall consumption of statins in Norway. Our objective was to explore how differences in prevalences of use, dosing characteristics, choice of statin and continuity of therapy in individual patients adds new information to previous results.
Methods: Data were retrieved from The Norwegian Prescription Database. We included individuals from counties with high, average, and low statin consumption, who had at least one statin prescription dispensed during 2004 (N = 40 143).1-year prevalence, prescribed daily dose (PDD), statin of choice, and continuity of therapy assessed by mean number of tablets per day.
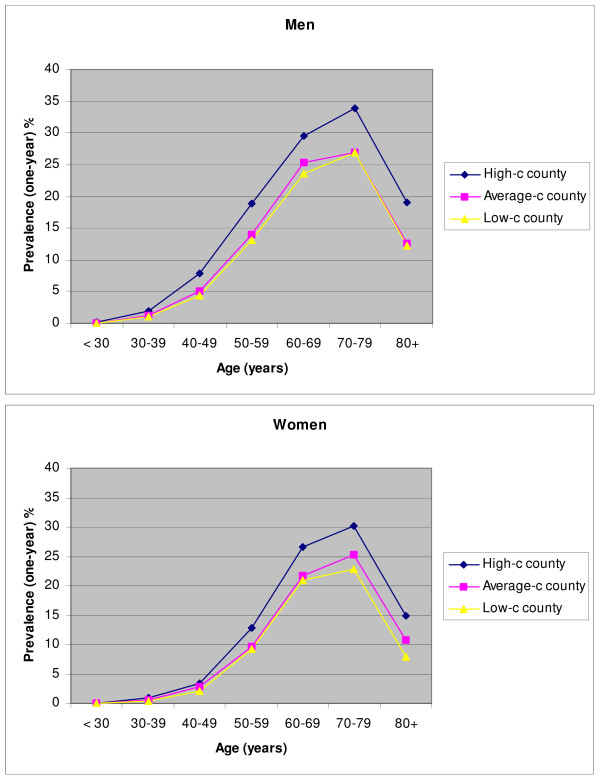
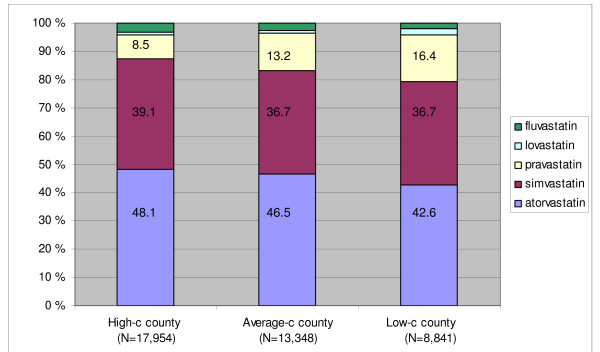
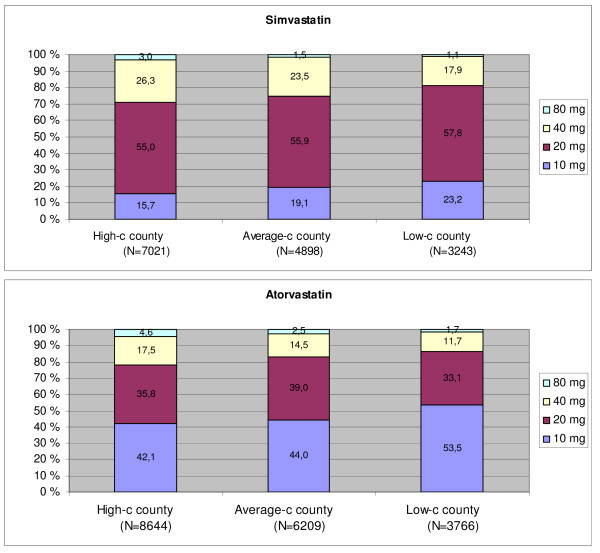
Results: The high-consumption county had higher prevalence of statin use in all age groups. Atorvastatin and simvastatin were dispensed in 79-87% of all statin users, and the proportion was significantly higher in the high-consumption county. The estimated PDDs were higher than the DDDs, up to twice the DDD for atorvastatin. The high-consumption county had the highest PDD for simvastatin (25.9 mg) and atorvastatin (21.9 mg), and more users received tablets in the upper range of available strengths. Continuity of therapy was similar in the three counties.
Conclusion: Although differences in age-distribution seems to be an important source of variation in statin consumption, it cannot account for the total variation between counties in Norway. Variations in prevalences of use, and treatment intensity in terms of PDD and choice of statin also affect the total consumption. The results in this study seems to correspond to previous findings of more frequent statin use in primary prevention, and more statin users achieving lipid goal in the highest consuming county.
Figures
Similar articles
-
Statin prescribing in the elderly in the Netherlands: a pharmacy database time trend study.Drugs Aging. 2010 Jul 1;27(7):589-96. doi: 10.2165/11537330-000000000-00000. Drugs Aging. 2010. PMID: 20583852
-
Cholesterol level goal attainment with statins: clinical management guideline recommendations versus management in actual clinical practice.Pharmacotherapy. 2012 Jul;32(7):631-41. doi: 10.1002/j.1875-9114.2011.01086.x. Pharmacotherapy. 2012. PMID: 22760692
-
Switching statins in Norway after new reimbursement policy: a nationwide prescription study.Br J Clin Pharmacol. 2007 Oct;64(4):476-81. doi: 10.1111/j.1365-2125.2007.02907.x. Epub 2007 Apr 18. Br J Clin Pharmacol. 2007. PMID: 17441934 Free PMC article.
-
Are statins created equal? Evidence from randomized trials of pravastatin, simvastatin, and atorvastatin for cardiovascular disease prevention.Am Heart J. 2006 Feb;151(2):273-81. doi: 10.1016/j.ahj.2005.04.003. Am Heart J. 2006. PMID: 16442888 Review.
-
Comparison of statins in hypertriglyceridemia.Am J Cardiol. 1998 Feb 26;81(4A):66B-69B. doi: 10.1016/s0002-9149(98)00041-1. Am J Cardiol. 1998. PMID: 9526817 Review.
Cited by
-
Effects of drug price reduction and prescribing restrictions on expenditures and utilisation of antihypertensive drugs in Korea.BMJ Open. 2015 Jul 15;5(7):e006940. doi: 10.1136/bmjopen-2014-006940. BMJ Open. 2015. PMID: 26179644 Free PMC article.
-
Prevalence and initiation of statin therapy in the oldest old-a longitudinal population-based study.Eur J Clin Pharmacol. 2022 Sep;78(9):1459-1467. doi: 10.1007/s00228-022-03343-w. Epub 2022 Jul 5. Eur J Clin Pharmacol. 2022. PMID: 35788725 Free PMC article.
-
Gender differences in statin prescription rates, adequacy of dosing, and association of statin therapy with outcome after heart failure hospitalization: a retrospective analysis in a community setting.Eur J Clin Pharmacol. 2016 Mar;72(3):311-9. doi: 10.1007/s00228-015-1980-2. Epub 2015 Nov 19. Eur J Clin Pharmacol. 2016. PMID: 26581760
-
Discrepancies between prescribed and defined daily doses: a matter of patients or drug classes?Eur J Clin Pharmacol. 2011 Aug;67(8):847-54. doi: 10.1007/s00228-011-1014-7. Epub 2011 Mar 10. Eur J Clin Pharmacol. 2011. PMID: 21544512 Free PMC article.
-
A retrospective cohort study of the potency of lipid-lowering therapy and race-gender differences in LDL cholesterol control.BMC Cardiovasc Disord. 2011 Sep 30;11:58. doi: 10.1186/1471-2261-11-58. BMC Cardiovasc Disord. 2011. PMID: 21961563 Free PMC article.
References
-
- Baigent C, Keech A, Kearney PM, Blackwell L, Buck G, Pollicino C, Kirby A, Sourjina T, Peto R, Collins R, Simes R, Cholesterol Treatment Trialists' (CTT) Collaborators Efficacy and safety of cholesterol-lowering treatment: prospective meta-analysis of data from 90,056 participants in 14 randomised trials of statins. Lancet. 2005;366:1267–1278. doi: 10.1016/S0140-6736(05)67394-1. - DOI - PubMed
-
- Drug sales statistics in Norway. Norwegian Institute of Public Health, Oslo Norway http://www.legemiddelforbruk.no/english
-
- The Norwegian Prescription Registry (NorPD) http://www.fhi.no/eway/default.aspx?pid=238&trg=MainLeft_5853&MainArea_5...
Publication types
MeSH terms
Substances
LinkOut - more resources
Full Text Sources
Medical
Research Materials
