Mutations in two global regulators lower individual mortality in Escherichia coli
- PMID: 18036141
- PMCID: PMC2229837
- DOI: 10.1111/j.1365-2958.2007.05988.x
Mutations in two global regulators lower individual mortality in Escherichia coli
Abstract
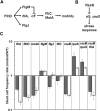
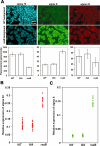
There has been considerable investigation into the survival of bacterial cells under stress conditions, but little is known about the causes of mortality in the absence of exogenous stress. That there is a basal frequency of cell death in such populations may reflect that it is either impossible to avoid all lethal events, or alternatively, that it is too costly. Here, through a genetic screen in the model organism Escherichia coli, we identify two mutants with lower frequencies of mortality: rssB and fliA. Intriguingly, these two genes both affect the levels of different sigma factors within the cell. The rssB mutant displays enhanced resistance to multiple external stresses, possibly indicating that the cell gains its increased vitality through elevated resistance to spontaneous, endogenous stresses. The loss of fliA does not result in elevated stress resistance; rather, its survival is apparently due to a decreased physical stress linked to the insertion of the flagellum through the membrane and energy saved through the loss of the motor proteins. The identification of these two mutants implies that reducing mortality is not impossible; rather, due to its cost, it is subject to trade-offs with other traits that contribute to the competitive success of the organism.
Figures


Similar articles
-
Adaptation in bacterial flagellar and motility systems: from regulon members to 'foraging'-like behavior in E. coli.Nucleic Acids Res. 2007;35(13):4441-52. doi: 10.1093/nar/gkm456. Epub 2007 Jun 18. Nucleic Acids Res. 2007. PMID: 17576668 Free PMC article.
-
Appropriate Regulation of the σE-Dependent Envelope Stress Response Is Necessary To Maintain Cell Envelope Integrity and Stationary-Phase Survival in Escherichia coli.J Bacteriol. 2017 May 25;199(12):e00089-17. doi: 10.1128/JB.00089-17. Print 2017 Jun 15. J Bacteriol. 2017. PMID: 28373273 Free PMC article.
-
Modulating RssB activity: IraP, a novel regulator of sigma(S) stability in Escherichia coli.Genes Dev. 2006 Apr 1;20(7):884-97. doi: 10.1101/gad.1400306. Genes Dev. 2006. PMID: 16600914 Free PMC article.
-
Back to log phase: sigma S as a global regulator in the osmotic control of gene expression in Escherichia coli.Mol Microbiol. 1996 Sep;21(5):887-93. doi: 10.1046/j.1365-2958.1996.511405.x. Mol Microbiol. 1996. PMID: 8885260 Review.
-
The two-component network and the general stress sigma factor RpoS (sigma S) in Escherichia coli.Adv Exp Med Biol. 2008;631:40-53. doi: 10.1007/978-0-387-78885-2_4. Adv Exp Med Biol. 2008. PMID: 18792681 Review.
Cited by
-
Fluctuation analysis: can estimates be trusted?PLoS One. 2013 Dec 9;8(12):e80958. doi: 10.1371/journal.pone.0080958. eCollection 2013. PLoS One. 2013. PMID: 24349026 Free PMC article.
-
The Good, the Bad, and the Ugly of ROS: New Insights on Aging and Aging-Related Diseases from Eukaryotic and Prokaryotic Model Organisms.Oxid Med Cell Longev. 2018 Mar 18;2018:1941285. doi: 10.1155/2018/1941285. eCollection 2018. Oxid Med Cell Longev. 2018. PMID: 29743972 Free PMC article. Review.
-
Rapid phenotypic individualization of bacterial sister cells.Sci Rep. 2017 Aug 16;7(1):8473. doi: 10.1038/s41598-017-08660-0. Sci Rep. 2017. PMID: 28814770 Free PMC article.
-
Pathogenicity-associated islands in extraintestinal pathogenic Escherichia coli are fitness elements involved in intestinal colonization.J Bacteriol. 2010 Oct;192(19):4885-93. doi: 10.1128/JB.00804-10. Epub 2010 Jul 23. J Bacteriol. 2010. PMID: 20656906 Free PMC article.
-
Mutations in adaptively evolved Escherichia coli LGE2 facilitated the cost-effective upgrading of undetoxified bio-oil to bioethanol fuel.Bioresour Bioprocess. 2021 Oct 22;8(1):105. doi: 10.1186/s40643-021-00459-2. Bioresour Bioprocess. 2021. PMID: 38650237 Free PMC article.
References
-
- Blattner FR, Plunkett G, Bloch CA, Perna NT, Burland V, et al. The complete genome sequence of Escherichia coli K-12. Science. 1997;277:1453–1474. - PubMed
-
- Barer MR, Harwood CR. Bacterial viability and culturability. Adv Microb Physiol. 1999;41:93–137. - PubMed
-
- Caetano-Anolles G. Amplifying DNA with arbitrary oligonucleotide primers. PCR Methods Appl. 1993;3:85–94. - PubMed
Publication types
MeSH terms
Substances
LinkOut - more resources
Full Text Sources
Molecular Biology Databases

