. 2008 Jan;7(1):101-11.
doi: 10.1111/j.1474-9726.2007.00357.x. Epub 2007 Nov 21.

Dynamic regulation of PGC-1alpha localization and turnover implicates mitochondrial adaptation in calorie restriction and the stress response

Affiliations

Dynamic regulation of PGC-1alpha localization and turnover implicates mitochondrial adaptation in calorie restriction and the stress response

Rozalyn M Anderson et al. Aging Cell. 2008 Jan.

Abstract

There is increasing evidence that longevity and stress resistance are connected, but the mechanism is unclear. We report that mitochondria are regulated in response to oxidative stress and calorie restriction through a shared mechanism involving peroxisome proliferator-activated receptor-gamma co-activator 1alpha (PGC-1alpha). We demonstrate that PGC-1alpha subcellular distribution is regulated, and its transcriptional activity is promoted through SIRT1-dependent nuclear accumulation. In addition, the duration of PGC-1alpha activity is regulated by glycogen synthase kinase beta (GSK3beta), which targets PGC-1alpha for intranuclear proteasomal degradation. This mechanism of regulation permits the rapidity and persistence of PGC-1alpha activation to be independently controlled. We provide evidence that this pathway of PGC-1alpha regulation occurs in vivo in mice, both in the oxidative stress response and with calorie restriction. Our data show how mitochondrial function may be adapted in response to external stimuli, and support the concept that such adaptation is critically involved in cellular survival and in lifespan extension by calorie restriction.


Figures
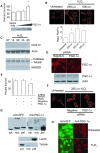
Fig. 1
Fig. 1
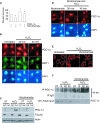
PGC-1α regulates mitochondrial function in response to stress. (A) Percent survival of NIH3T3 fibroblasts after treatment with H2O2 (350 µm); values represent means ± standard error of the mean (SEM); * indicates significant difference in survival compared to vector control (P < 0.05). (B) MitoTracker Red or JC-1 measurement of mitochondrial membrane potential in 1 h of H2O2treatment at indicated doses. Higher ratio of Fl2/Fl1 is indicative of higher membrane potential. Values represent means ± SEM; * indicates significant difference compared to untreated (P < 0.05). (C) Western analysis of COX IV, catalase and MnSOD in cell lysates taken at indicated times following exposure to hydrogen peroxide (350 µm). (D) PGC-1α RNA interference specifically reduces the level of PGC-1α as detected by immunofluorescence and Western blot. (E) Percent survival in cells exposed to H2O2 (350 µm, 1 h). Values represent means ± SEM; * indicates significant difference in survival compared to mock treatment and negative control (P < 0.05). (F) Mitochondrial membrane potential detected using Mitotracker Red in cells exposed to H2O2 (350 µm, 1 h). (G) Western blot to detect GFP or PGC-1α in equivalent relative amounts of protein from cytoplasmic and nuclear extracts, a four times equivalent of the insoluble nuclear pellet was loaded to facilitate detection. (H) Immunofluorescent detection of PGC-1α in cells over-expressing GFP-tagged PGC-1α and grown in the absence or presence of H2O2 (350 µm, 45 min) using anti-GFP or anti-PGC-1α antibodies.
Fig. 2
Fig. 2
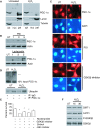
SIRT1 regulates PGC-1α subcellular localization and activity in response to stress. (A) Percent survival of cells after exposure to H2O2 (350 µm, 1 h) with or without nicotinamide (10 mm); values represent means ± standard error of the mean; * indicates significant difference in survival compared to control cells; + indicates significant difference in survival compared to peroxide-treated control cells (P < 0.05). (B) Immunofluorescent detection of PGC-1α and SIRT1 in cells following treatment with H2O2 (350 µm). Nuclei were visualized with DAPI stain. (C) PGC-1α in cytoplasmic (cyt) and nuclear (nuc) subcellular fractions in cultured cells after treatment with H2O2 (350 µm, 45 min), with or without nicotinamide (10 mm). (D) Immunofluorescent detection of PGC-1α in nicotinamide-treated cells (10 mm) after treatment with hydrogen peroxide (350 µm, 45 min). (E) Mitotracker Red detection of mitochondrial membrane potential after exposure to H2O2 (350 µm, 1 h) in nicotinamide- (10 mm) treated cells. (F) Detection of acetylated PGC-1α by Western in immunoprecipitates from cells following exposure to hydrogen peroxide (350 mm), with and without nicotinamide (10 mm).
Fig. 3
Fig. 3
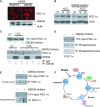
PGC-1α is targeted for GSK3β-dependent proteasomal degradation in response to oxidative stress. (A) Detection of PGC-1α protein by Western blot in subcellular fractions from cells 1 h after treatment with hydrogen peroxide (350 µm). (B) Detection of PGC-1α protein by Western blot in whole cell lysates from cells treated with proteasomal inhibitors PSI (10 µm) and lactacystin (10 µm) for the indicated times in hours. (C) Immunofluorescent detection of PGC-1α after treatment with hydrogen peroxide (350 µm, 45 min); cells were grown under normal conditions or with proteasomal (PSI 10 µm) or GSK3β (GSK3β inhibitor VIII 20 µm) inhibitors prior to and during stress. (D) Detection of ubiquitinated species by Western blot of PGC-1α immunoprecipitates from untreated and hydrogen-peroxide-treated cells (350 µm, 45 min). (E) Percent survival of cells after exposure to hydrogen peroxide (350 µm, 1 h); cells were grown under normal conditions or pre-incubated with nicotinamide (10 µm), GSK3β Inhibitor VII (20 µm), sirtinol (25 µm) or c-Jun N-terminal kinase (JNK) inhibitor II (25 µm); values represent means ± standard error of the mean; * indicates significant difference in survival compared to peroxide-treated control cells (P < 0.05). (F) Western blot detection of SIRT1, phospho-GSK3β and GSK3β in extracts taken at the times indicated in minutes from cells exposed to hydrogen peroxide (350 µm).
Fig. 4
Fig. 4
GSK3β-dependent phosphorylation of peroxisome proliferator-activated receptor-γ co-activator 1α (PGC-1α) in reponse to stress. (A) Immunofluorescent detection of PGC-1α in cells 24 h following siRNA with negative control or GSK3β-specific oligonucleotides. Knock down of GSK3β detected by Western blot (lower panel). (B) Western blot detection of PGC-1α in extracts taken at the indicated times in minutes following hydrogen peroxide treatment (350 µm); cells were grown under normal conditions or in the presence of GSK3β inhibitor VII (20 µm) prior to and during stress. (C) Detection of PGC-1α by Western blot of GSK3β immunoprecipitates from untreated or hydrogen-peroxide-treated cells (350 µm, 15 min); cells were grown in the absence or presence of GSK3β inhibitor VII (20 µm). (D) Detection of PGC-1α in phosphoserine and phosphothreonine immunoprecipitates from hydrogen-peroxide-treated cells (350 µm, 15 min); cells were grown in the absence or presence of GSK3β inhibitor VII (20 µm). (E) Detection of phosphoserine and phosphothreonine phosphorylated species by Western blot of PGC-1α immunoprecipitates from hydrogen-peroxide-treated cells (350 µm, 15 min); cells were grown in the absence or presence of GSK3β inhibitor VII (20 µm). (F) Model of PGC-1α activation in response to oxidative stress.
Fig. 5
Fig. 5
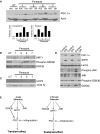
PGC-1α is regulated by SIRT1 and GSK3β during oxidative stress and calorie restriction (CR) in mice in vivo. (A) Western detection of PGC-1α in nuclear (nuc) and cytoplasmic (cyt) subcellular fractions from skeletal muscle of 5-month-old mice taken at indicated hours following exposure to paraquat (50 mg kg−1 body weight). Densitometric analysis of normalized PGC-1α levels detected in cytoplasmic and nuclear fractions at indicated times. (B) Western detection of SIRT1, GSK3β and phospho-GSK3β in whole tissue homogenates of skeletal muscle of 5-month-old mice taken at indicated hours following exposure to paraquat (50 mg kg−1 body weight). (C) Western detection of UCP3 and COX IV in cytoplasmic fraction of skeletal muscle of 5-month-old mice taken at indicated hours following exposure to paraquat (50 mg kg−1 body weight). (D) Western detection of SIRT1, phospho-c-Jun N-terminal kinase (JNK), JNK, phospho-GSK3β and GSK3β in white adipose tissue from control (Control) and restricted (CR) 10-month-old mice. (E) Model describing regulation of PGC-1α that permits transient or sustained effects on PGC-1α activity.

Similar articles

Cited by

References

    1. Aberle H, Bauer A, Stappert J, Kispert A, Kemler R. beta-catenin is a target for the ubiquitin-proteasome pathway. EMBO J. 1997;16:3797–3804. - PMC - PubMed
    1. Anderson RM, Weindruch R. Metabolic reprogramming in dietary restriction. Interdiscip Top Gerontol. 2007;35:18–38. - PMC - PubMed
    1. Anderson RM, Bitterman KJ, Wood JG, Medvedik O, Sinclair DA. Nicotinamide and PNC1 govern lifespan extension by calorie restriction in Saccharomyces cerevisiae. Nature. 2003;423:181–185. - PMC - PubMed
    1. Avalos JL, Bever KM, Wolberger C. Mechanism of sirtuin inhibition by nicotinamide: altering the NAD(+) cosubstrate specificity of a Sir2 enzyme. Mol Cell. 2005;17:855–868. - PubMed
    1. Baar K, Wende AR, Jones TE, Marison M, Nolte LA, Chen M, Kelly DP, Holloszy JO. Adaptations of skeletal muscle to exercise: rapid increase in the transcriptional coactivator PGC-1. FASEB J. 2002;16:1879–1886. - PubMed

Publication types

MeSH terms