Species-specific endogenous retroviruses shape the transcriptional network of the human tumor suppressor protein p53
- PMID: 18003932
- PMCID: PMC2141825
- DOI: 10.1073/pnas.0703637104
Species-specific endogenous retroviruses shape the transcriptional network of the human tumor suppressor protein p53
Abstract
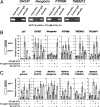
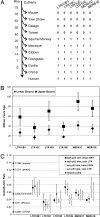
The evolutionary forces that establish and hone target gene networks of transcription factors are largely unknown. Transposition of retroelements may play a role, but its global importance, beyond a few well described examples for isolated genes, is not clear. We report that LTR class I endogenous retrovirus (ERV) retroelements impact considerably the transcriptional network of human tumor suppressor protein p53. A total of 1,509 of approximately 319,000 human ERV LTR regions have a near-perfect p53 DNA binding site. The LTR10 and MER61 families are particularly enriched for copies with a p53 site. These ERV families are primate-specific and transposed actively near the time when the New World and Old World monkey lineages split. Other mammalian species lack these p53 response elements. Analysis of published genomewide ChIP data for p53 indicates that more than one-third of identified p53 binding sites are accounted for by ERV copies with a p53 site. ChIP and expression studies for individual genes indicate that human ERV p53 sites are likely part of the p53 transcriptional program and direct regulation of p53 target genes. These results demonstrate how retroelements can significantly shape the regulatory network of a transcription factor in a species-specific manner.
Conflict of interest statement
The authors declare no conflict of interest.
Figures


Similar articles
-
The transcriptional activity of HERV-I LTR is negatively regulated by its cis-elements and wild type p53 tumor suppressor protein.J Biomed Sci. 2007 Mar;14(2):211-22. doi: 10.1007/s11373-006-9126-2. Epub 2006 Dec 7. J Biomed Sci. 2007. PMID: 17151828
-
Long non-coding RNAs transcribed by ERV-9 LTR retrotransposon act in cis to modulate long-range LTR enhancer function.Nucleic Acids Res. 2017 May 5;45(8):4479-4492. doi: 10.1093/nar/gkx055. Nucleic Acids Res. 2017. PMID: 28132025 Free PMC article.
-
Regulatory evolution of innate immunity through co-option of endogenous retroviruses.Science. 2016 Mar 4;351(6277):1083-7. doi: 10.1126/science.aad5497. Science. 2016. PMID: 26941318 Free PMC article.
-
The impact of post-transcriptional regulation in the p53 network.Brief Funct Genomics. 2013 Jan;12(1):46-57. doi: 10.1093/bfgp/els058. Epub 2012 Dec 14. Brief Funct Genomics. 2013. PMID: 23242178 Free PMC article. Review.
-
Endogenous retroviral LTRs as promoters for human genes: a critical assessment.Gene. 2009 Dec 15;448(2):105-14. doi: 10.1016/j.gene.2009.06.020. Epub 2009 Jul 3. Gene. 2009. PMID: 19577618 Review.
Cited by
-
Waves of retrotransposon expansion remodel genome organization and CTCF binding in multiple mammalian lineages.Cell. 2012 Jan 20;148(1-2):335-48. doi: 10.1016/j.cell.2011.11.058. Epub 2012 Jan 12. Cell. 2012. PMID: 22244452 Free PMC article.
-
Endogenous Retrovirus RNA Expression Differences between Race, Stage and HPV Status Offer Improved Prognostication among Women with Cervical Cancer.Int J Mol Sci. 2023 Jan 12;24(2):1492. doi: 10.3390/ijms24021492. Int J Mol Sci. 2023. PMID: 36675007 Free PMC article.
-
A mouse-specific retrotransposon drives a conserved Cdk2ap1 isoform essential for development.Cell. 2021 Oct 28;184(22):5541-5558.e22. doi: 10.1016/j.cell.2021.09.021. Epub 2021 Oct 12. Cell. 2021. PMID: 34644528 Free PMC article.
-
Mobile DNA and the TE-Thrust hypothesis: supporting evidence from the primates.Mob DNA. 2011 May 31;2(1):8. doi: 10.1186/1759-8753-2-8. Mob DNA. 2011. PMID: 21627776 Free PMC article.
-
The Th1 cell regulatory circuitry is largely conserved between human and mouse.Life Sci Alliance. 2021 Sep 16;4(11):e202101075. doi: 10.26508/lsa.202101075. Print 2021 Nov. Life Sci Alliance. 2021. PMID: 34531288 Free PMC article.
References
-
- Lander ES, Linton LM, Birren B, Nusbaum C, Zody MC, Baldwin J, Devon K, Dewar K, Doyle M., FitzHugh W, et al. Nature. 2001;409:860–921. - PubMed
-
- Waterston RH, Lindblad-Toh K, Birney E, Rogers J, Abril JF, Agarwal P, Agarwala R, Ainscough R, Alexandersson M, An P, et al. Nature. 2002;420:520–562. - PubMed
-
- Bannert N, Kurth R. Annu Rev Genomics Hum Genet. 2006;7:149–173. - PubMed
-
- Gifford R, Tristem M. Virus Genes. 2003;26:291–315. - PubMed
Publication types
MeSH terms
Substances
LinkOut - more resources
Full Text Sources
Other Literature Sources
Research Materials
Miscellaneous

