Comparative Study

Discovery of functional elements in 12 Drosophila genomes using evolutionary signatures

Alexander Stark et al. Nature. .

Abstract

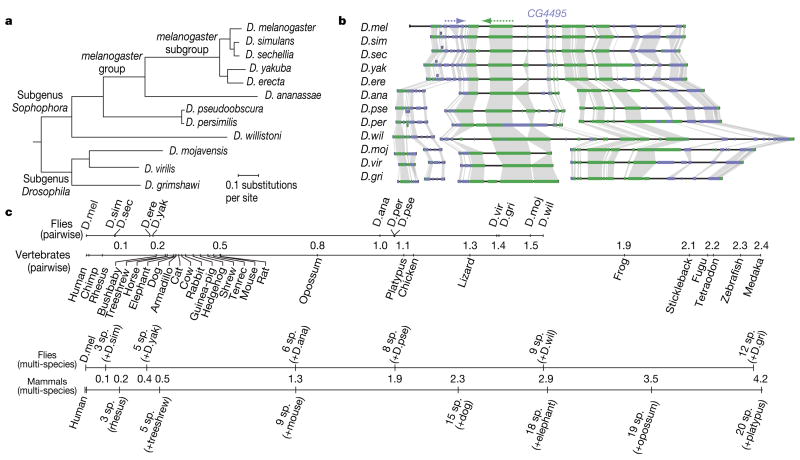
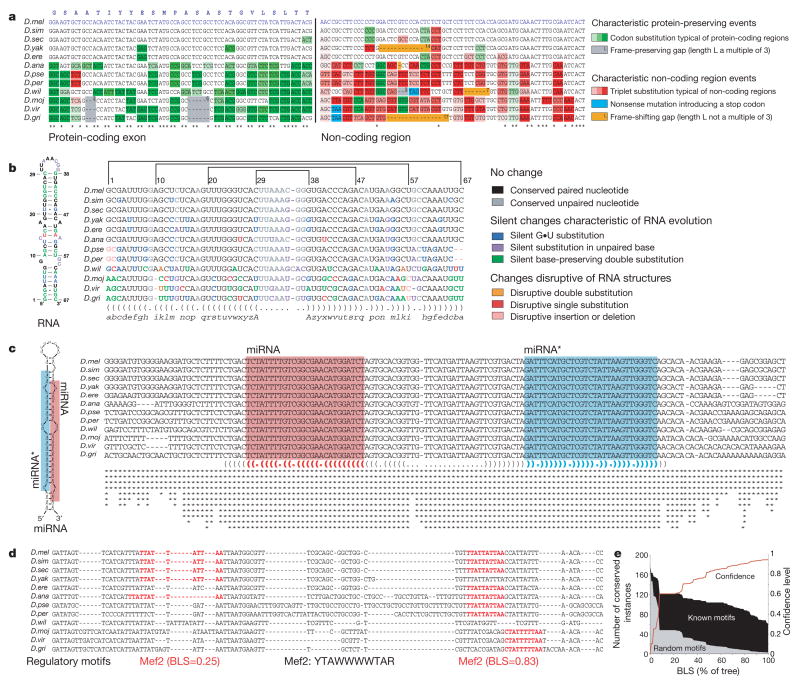
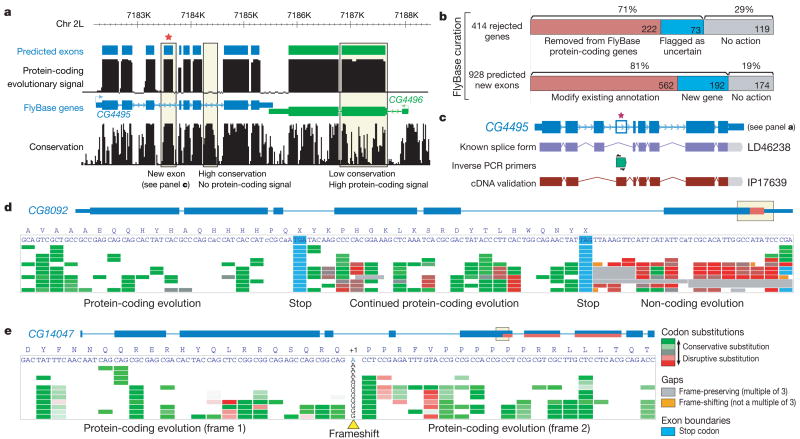
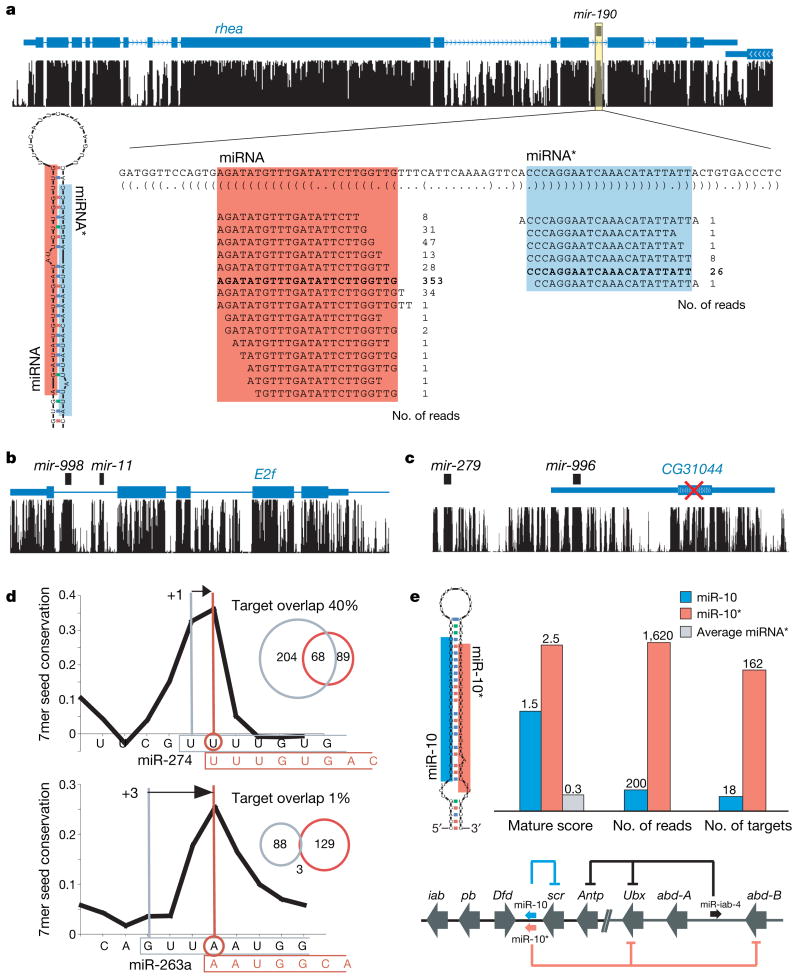
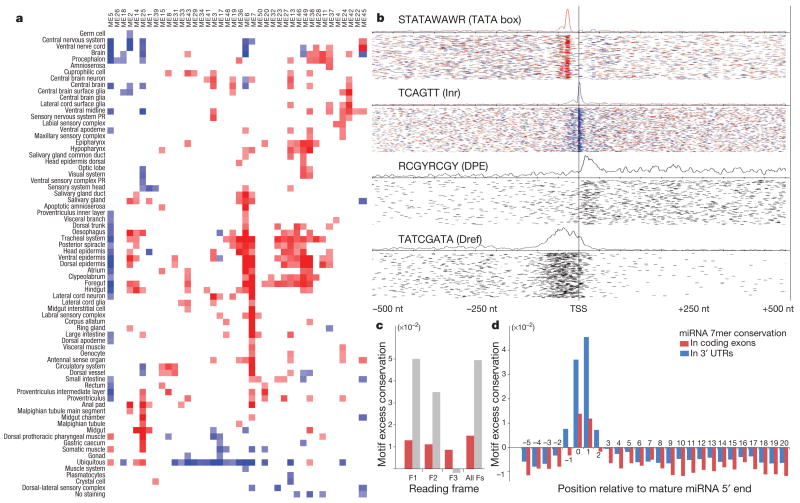
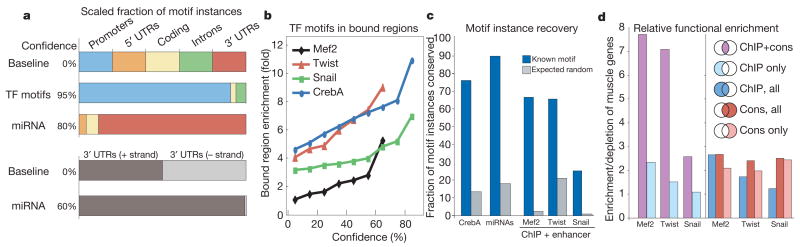
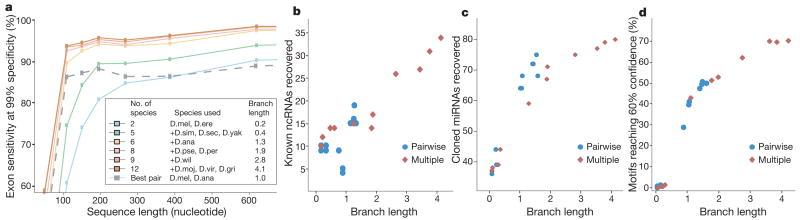
Sequencing of multiple related species followed by comparative genomics analysis constitutes a powerful approach for the systematic understanding of any genome. Here, we use the genomes of 12 Drosophila species for the de novo discovery of functional elements in the fly. Each type of functional element shows characteristic patterns of change, or 'evolutionary signatures', dictated by its precise selective constraints. Such signatures enable recognition of new protein-coding genes and exons, spurious and incorrect gene annotations, and numerous unusual gene structures, including abundant stop-codon readthrough. Similarly, we predict non-protein-coding RNA genes and structures, and new microRNA (miRNA) genes. We provide evidence of miRNA processing and functionality from both hairpin arms and both DNA strands. We identify several classes of pre- and post-transcriptional regulatory motifs, and predict individual motif instances with high confidence. We also study how discovery power scales with the divergence and number of species compared, and we provide general guidelines for comparative studies.


Figures

Figure 1
Figure 1. Phylogeny and alignment of 12 Drosophila species
a, Phylogenetic tree relating the 12 Drosophila species, estimated from fourfold degenerate sites (Supplementary Methods 1). The 12 species span a total branch length of 4.13 substitutions per neutral site. b, Gene order conservation for a 0.45-Mb region of chromosome 2L centred on CG4495, for which we predict a new exon (Fig. 3a), and spanning 35 genes. Colour represents the direction of transcription. Boxes represent full gene models. Individual exons and introns are not shown. c, Comparison of evolutionary distances spanned by fly and vertebrate trees. Pairwise and multi-species distances (in substitutions per fourfold degenerate site) are shown from D. melanogaster and from human as reference genomes. Note that species with longer branches (for example, mouse) show higher pairwise distances, not always reflecting the order of divergence. Multi-species distances include all species within a phylogenetic clade.
Figure 2
Figure 2. Distinct evolutionary signatures for diverse classes of functional elements
a, Protein-coding genes tolerate mutations that preserve the amino-acid translation, leading to abundant conservative codon substitutions (green). Insertions and deletions are largely constrained to be a multiple of three (grey). In contrast, non-coding regions show abundant non-conservative triplet substitutions (red), nonsense mutations (blue) and frame-shifting insertions and deletions (orange). b, RNA genes tolerate mutations that preserve the secondary structure (for example, single substitutions involving G•U base pairs and compensatory changes) and exclude structure-disrupting mutations. Matching parentheses and matching letters of the alphabet indicate paired bases. c, MicroRNA genes, in contrast, generally do not show changes in stem regions, but tolerate substitutions in loop regions and flanking unpaired regions, leading to a distinctive conservation profile. Asterisks denote the number of informant species matching the melanogaster sequence at each position. d, Regulatory motifs tolerate local movement and nucleotide substitutions consistent with their degeneracy patterns, and show increased conservation across the phylogenetic tree, measured as the branch length score (BLS; Supplementary Methods 5a). e, Increasing BLS thresholds select for instances of known motifs (black) at increasing confidence (red), as the number of conserved instances of control motifs (grey) drops significantly faster.
Figure 3
Figure 3. Revisiting the protein-coding gene catalogue and revealing unusual gene structures
a, Protein-coding evolutionary signatures correlate with annotated protein-coding exons more precisely than the overall conservation level (phastCons track33), for example excluding highly conserved yet non-coding elements. Asterisk denotes new predicted exon, which we validate with cDNA sequencing (see panel c). The height of the black tracks indicates protein-coding potential according to evolutionary signatures (top) and overall sequence conservation (bottom). Blue and green boxes indicate predicted coding exons (top) and the current FlyBase annotation (bottom). The region shown represents the central 6 kb of Fig. 1b, rendered by the UCSC genome browser. b, Results of FlyBase curation of 414 genes rejected by evolutionary signatures (Table 1), and 928 predicted new exons. c, Experimental validation of predicted new exon from panel a. Inverse PCR with primers in the predicted exon (green) results in a full-length cDNA clone, confirming the predicted exon and revealing a new alternative splice form for CG4495. d, Protein-coding evolution continues downstream of a conserved stop codon in 149 genes, suggesting translational readthrough. e, Codon-based evolutionary signatures (CSF score) abruptly shift from one reading frame to another within a protein-coding exon, suggesting a conserved, ‘programmed’ frameshift.
Figure 4
Figure 4. Novel RNA structures
a, New exonic RNA structure spanning 78 of 90 nucleotides of spineless exon 5. b, New intronic RNA structure in lodestar shows 11 compensatory substitutions and 10 silent G•U substitutions, providing strong evidence of structural selection (colours as in Fig. 2b). c, New 5′ UTR structure that overlaps the translation start site of CG6764, the fly orthologue of yeast ribosomal protein RPL24, suggesting a potential role in translational regulation. ac, Structure shown corresponds to shaded region in the gene model.
Figure 5
Figure 5. MicroRNA gene identification and functional implications
a, New predicted miRNA (mir-190) and its validation by sequencing reads. Total read counts for mature miRNA (red) and miRNA* (blue) show a characteristic pattern of processing indicative of miRNAs. Highlighted regions indicate most abundant processing products. b, Example of clustered known (mir-11) and new (mir-998) miRNAs in the intron of cell-cycle regulator E2f. c, Example of a new miRNA (mir-996) in the transcript of a spurious gene. CG31044 was rejected by our protein-coding analysis, its transcript probably representing the precursor of mir-996, with no protein-coding function. d, Revisions to the 5′ end of miR-274 and miR-263a are proposed on the basis of evolutionary evidence (for example, 7mer seed conservation; black curve) and confirmed by sequencing reads. Changes at the 5′ end of more than one nucleotide results in marked changes to the predicted target spectra (venn diagrams). e, Evidence from evolutionary signals (mature score), sequencing reads and target predictions suggests that both miR-10 and miR-10* are functional, each targeting distinct Hox genes.
Figure 6
Figure 6. Regulatory motif discovery
a, Discovered motifs show enrichment (red) or depletion (blue) in genes expressed in a given tissue (log colour range from P =10−5 enrichment to P =10−5 depletion). Bi-clustering reveals groups of motifs with similar tissue enrichment and groups of tissues with similar motif content. Full matrix and randomized control is shown in Supplementary Fig. 6d. b, Positional bias of discovered motifs relative to transcription start sites (TSS). Peaks with highly specific distances from the transcription start site (for example, first three plots) are characteristic of core promoter elements, and broad peaks (for example, fourth plot) are characteristic of transcription factors. For non-palindromic motifs, colours indicate forward-strand (red) and reverse-strand (blue) instances. Curves denote the density of all instances and individual segments denote individual motif instances, summed across groups of 50 genes (each line). c, Coding regions show reading-frame-invariant conservation for miRNA motifs (red) and reading-frame-biased conservation for protein motifs (grey). MEC scores are evaluated for each of the three reading frame offsets (F1–F3) and also without frame correction (all Fs). Plots show average MEC for all miRNA motifs and 500 top-scoring protein-coding motifs (based on MEC without frame correction). d, Motif excess conservation (MEC) of 7mer complements at different offsets with respect to miRNA 5′ end, averaged across all Rfam miRNAs. MEC scores evaluated in protein-coding regions and 3′ UTRs show a highly similar profile (correlation coefficient 0.96), suggesting similar evolutionary constraints.
Figure 7
Figure 7. Identification of individual motif instances
a, Increasing confidence levels select for motif instances in regions they are known to be functional: conserved transcription factor (TF) motifs enrich for promoters; miRNA motifs for 3′UTRs, and specifically the transcribed strand. Regions are normalized for their overall length, measured by the number of motif instances without conservation (0% confidence baseline). b, Increasing confidence levels select for transcription factor motif instances with experimental support for each factor tested. c, The high fraction of experimentally supported motif instances that are recovered at 60% confidence for transcription factors and 80% confidence for miRNAs illustrates the high sensitivity of the BLS approach. d, Comparison of chromatin immunoprecipitation (ChIP) and conservation in their ability to identify functional motif instances. Motif instances that are both ChIP-bound and conserved (purple) show the strongest functional enrichment in muscle genes for Mef2 and Twist (depletion for Snail), whereas motif instances derived by ChIP alone (light blue) show substantially reduced enrichment levels. Comparing the enrichment of all instances recovered by ChIP (blue) and all instances recovered by conservation (red) suggests that the two approaches perform comparably. Even the sites recovered by conservation alone outside bound regions (pink) show enrichment levels comparable to ChIP, suggesting that they are also functional.
Figure 8
Figure 8. Scaling of discovery power with the number and distance of informant species
a, Discriminatory power of CSF protein-coding evolutionary metric for varying exon lengths and using different numbers of informant species. Sensitivity is shown for known exons at a fixed false-positive rate based on random non-coding regions. Mean length is shown for each exon length quantile. Multi-species comparisons increase discovery power, especially among short exons. b, Recovery of known ncRNAs (among the top 100 predictions) for pairwise (blue) and multi-species (red) comparisons. c, Recovery of cloned miRNAs (among the top 100 predictions). d, Recovery of transcription factor and miRNA motifs with instances at 60% confidence.

Comment in

Similar articles

  • Evolution of genes and genomes on the Drosophila phylogeny.
    Drosophila 12 Genomes Consortium; Clark AG, Eisen MB, Smith DR, Bergman CM, Oliver B, Markow TA, Kaufman TC, Kellis M, Gelbart W, Iyer VN, Pollard DA, Sackton TB, Larracuente AM, Singh ND, Abad JP, Abt DN, Adryan B, Aguade M, Akashi H, Anderson WW, Aquadro CF, Ardell DH, Arguello R, Artieri CG, Barbash DA, Barker D, Barsanti P, Batterham P, Batzoglou S, Begun D, Bhutkar A, Blanco E, Bosak SA, Bradley RK, Brand AD, Brent MR, Brooks AN, Brown RH, Butlin RK, Caggese C, Calvi BR, Bernardo de Carvalho A, Caspi A, Castrezana S, Celniker SE, Chang JL, Chapple C, Chatterji S, Chinwalla A, Civetta A, Clifton SW, Comeron JM, Costello JC, Coyne JA, Daub J, David RG, Delcher AL, Delehaunty K, Do CB, Ebling H, Edwards K, Eickbush T, Evans JD, Filipski A, Findeiss S, Freyhult E, Fulton L, Fulton R, Garcia AC, Gardiner A, Garfield DA, Garvin BE, Gibson G, Gilbert D, Gnerre S, Godfrey J, Good R, Gotea V, Gravely B, Greenberg AJ, Griffiths-Jones S, Gross S, Guigo R, Gustafson EA, Haerty W, Hahn MW, Halligan DL, Halpern AL, Halter GM, Han MV, Heger A, Hillier L, Hinrichs AS, Holmes I, Hoskins RA, Hubisz MJ, Hultmark D, Huntley MA, Jaffe DB, Jagadeeshan S, Jeck WR, Johnson J, Jones CD, Jordan WC, Ka… See abstract for full author list ➔ Drosophila 12 Genomes Consortium, et al. Nature. 2007 Nov 8;450(7167):203-18. doi: 10.1038/nature06341. Nature. 2007. PMID: 17994087
  • Revisiting the protein-coding gene catalog of Drosophila melanogaster using 12 fly genomes.
    Lin MF, Carlson JW, Crosby MA, Matthews BB, Yu C, Park S, Wan KH, Schroeder AJ, Gramates LS, St Pierre SE, Roark M, Wiley KL Jr, Kulathinal RJ, Zhang P, Myrick KV, Antone JV, Celniker SE, Gelbart WM, Kellis M. Lin MF, et al. Genome Res. 2007 Dec;17(12):1823-36. doi: 10.1101/gr.6679507. Epub 2007 Nov 7. Genome Res. 2007. PMID: 17989253 Free PMC article.
  • Systematic discovery and characterization of fly microRNAs using 12 Drosophila genomes.
    Stark A, Kheradpour P, Parts L, Brennecke J, Hodges E, Hannon GJ, Kellis M. Stark A, et al. Genome Res. 2007 Dec;17(12):1865-79. doi: 10.1101/gr.6593807. Epub 2007 Nov 7. Genome Res. 2007. PMID: 17989255 Free PMC article.
  • Regulatory RNAs in the light of Drosophila genomics.
    Marco A. Marco A. Brief Funct Genomics. 2012 Sep;11(5):356-65. doi: 10.1093/bfgp/els033. Epub 2012 Sep 5. Brief Funct Genomics. 2012. PMID: 22956639 Free PMC article. Review.
  • Helitrons shaping the genomic architecture of Drosophila: enrichment of DINE-TR1 in α- and β-heterochromatin, satellite DNA emergence, and piRNA expression.
    Dias GB, Heringer P, Svartman M, Kuhn GC. Dias GB, et al. Chromosome Res. 2015 Sep;23(3):597-613. doi: 10.1007/s10577-015-9480-x. Chromosome Res. 2015. PMID: 26408292 Review.

Cited by

References

    1. Miller W, Makova KD, Nekrutenko A, Hardison RC. Comparative genomics. Annu Rev Genomics Hum Genet. 2004;5:15–56. - PubMed
    1. Ureta-Vidal A, Ettwiller L, Birney E. Comparative genomics: genome-wide analysis in metazoan eukaryotes. Nature Rev Genet. 2003;4:251–262. - PubMed
    1. Kellis M, et al. Sequencing and comparison of yeast species to identify genes and regulatory elements. Nature. 2003;423:241–254. - PubMed
    1. Cliften P, et al. Finding functional features in Saccharomyces genomes by phylogenetic footprinting. Science. 2003;301:71–76. - PubMed
    1. Brent MR. Genome annotation past, present, and future: how to define an ORF at each locus. Genome Res. 2005;15:1777–1786. - PubMed

Publication types

LinkOut - more resources