Comparative Study
. 2007 Nov 7;27(45):12419-29.
doi: 10.1523/JNEUROSCI.2015-07.2007.

Independent expression of synaptic and morphological plasticity associated with long-term depression

Affiliations
Comparative Study

Independent expression of synaptic and morphological plasticity associated with long-term depression

Xiao-bin Wang et al. J Neurosci. .

Abstract

Physiological and morphological alterations occur with long-term synaptic modifications, such as long-term potentiation (LTP) and long-term depression (LTD), but whether these two processes are independent or interactive is unclear. It is also unknown whether or how morphological modifications, like spine remodeling, may contribute to physiological modifications, such as trafficking of glutamate receptors which underlies, at least partially, the expression of LTP and LTD. In this study, we monitored spine size and synaptic responses simultaneously using combined two photon time-lapse imaging with patch-clamp recording in acute hippocampal slices. We show that spine shrinkage and LTD can occur independently of each other. We further show that changes in spine size are unrelated to trafficking of AMPA receptors (AMPARs) under various conditions: constitutive trafficking of AMPARs, insulin-induced internalization of AMPARs, or lateral movement of AMPARs to extrasynaptic sites. Induction of LTD of NMDA receptor-mediated responses (NMDAR-LTD) is associated with spine shrinkage. Nonetheless, NMDAR-LTD and spine shrinkage diverge in the downstream signaling events, and can occur independently of each other. Thus, spine shrinkage is not caused by or required for trafficking of glutamate receptors. In a broader sense, there is a clear dissociation between physiological and morphological expression of LTD. However, inhibition of actin depolymerization blocked the expression of LTD, suggesting that morphologically silent actin remodeling may be involved in the physiological expression of LTD and different subpopulations of actin filaments undergo changes during LTD.


Figures
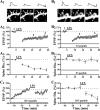
Figure 1.
Figure 1.
Spine shrinkage and LTD are independent processes. A1, Representative example of both EPSPs (average of 5 consecutive traces) and dendritic spines which were monitored simultaneously before, 30 min and 60 min after LFS (1 Hz for 15 min, 900 pulses). Reduction in both spine size and EPSPs were observed after LFS. The numbers on the images correspond to that on the plot in A2, indicating when image and voltage traces were acquired. Stable and shrinking spines are indicated by arrows and arrowheads, respectively. A2, Plot of normalized slope of EPSPs (mean ± SEM) showed the expression of LTD after LFS (bar). A3, Population data showed that LFS induced spine shrinkage. B1, Another sample experiment showing the absence of spine shrinkage but normal LTD when the S3 (or p-cofilin) peptide was internally loaded into a neuron with the recording patch pipette. Clearly resolved spines that did not exhibit shrinkage were marked by arrows. B2, Population results from similar experiments showed that S3 peptide did not block LFS-induced synaptic depression. B3, Population data showed that spine size was not altered (spine diameters at 45 min after LFS were 100.7 ± 4.4% of baseline level; p = 0.81; Wilcoxon's signed ranks test; n = 46 spines/5 cells) in neurons loaded with the S3 peptide. C1, Internal loading of the D15 peptide led to enhancement of EPSP and inhibition of subsequent induction of LTD (EPSP slopes were 102.3 ± 8.1% of plateau level at 30 min after LFS; p = 0.87; paired t test; n = 7 cells) with LFS. C2, Changes in spine size did not occur during the period of EPSP enhancement, but spine shrinkage occurred after LFS. Calibration: A1, 10 mV, 50 ms; A2, 5 mV, 50 ms. Scale bars: A1, A2, 1 μm.
Figure 2.
Figure 2.
Constitutive trafficking of AMPARs is not associated with changes in spine size. A, Internal loading of NEM led to synaptic depression which developed in 20–30 min (n = 7 cells). Sample EPSP traces were shown at the time points when they were acquired. B, No significant change in spine size was seen, albeit significant reduction in EPSPs in neurons loaded with NEM (n = 68 spines/7 cells). C, Internal loading of the light chain of botulinum toxin type B (BoTox) led to a rapid decrease in synaptic responses, which reached a plateau in ∼20 min. The EPSP slopes were 55.3 ± 8.6% of baseline at 30 min after loading BoTox (n = 7 cells; p < 0.001; paired t test). D, No significant changes in spine size were observed during the period of rapid synaptic depression in the BoTox-loaded neurons. E, Internal loading of the D15 peptide enhanced synaptic transmission. F, No change in spine size was observed during the period of increase in synaptic responses in neurons loaded with the D15 peptide (spine diameters were 99.3 ± 1.3% of the baseline level at 30 min after loading of D15; p = 0.69; Wilcoxon's signed ranks test; n = 101 spines/7 cells). Note all experiments shown here were performed using the Bolus labeling method. Neurons were loaded with calcein in the absence of NEM, BoTox, or D15 peptide with the first recording to label spines. After the first set of images were acquired, patch recording with the second electrode, which contained NEM, BoTox, or the D15 peptide was made in the same neuron (the bars indicated the onset of the second recording). Synaptic stimulation started at time “0.” Calibration: A, C, E, 5 mV and 50 ms.
Figure 3.
Figure 3.
Insulin-induced synaptic depression is not accompanied with spine shrinkage. A, A sample experiment showing robust reduction in EPSPs and no change in spine size after bath perfusion of insulin. Clearly resolved spines were marked by arrows. B, Population data showed no changes in spine size (▴) at 30 min after insulin application in the presence of significant synaptic depression (○). C, Images were acquired at higher rate (every 30 s) to capture potentially rapid or transient changes in spine size. No rapid or transient change in spine size was observed during or shortly after bath application of insulin (▴; n = 76 spines/7 cells). On the contrary, rapid and persistent decrease in EPSP slopes were seen after insulin application (○). D, Spine size was stable for ∼2 h after bath application of insulin (▴; spine diameters were 96.21 ± 2.8% of preinsulin level at 90 min after insulin application; p = 0.63; Wilcoxon's signed ranks test; n = 55 spines/4 cells) in the presence of persistent reduction in EPSPs (○). E, LFS given at the plateau of insulin-induced synaptic depression did not induce additional reduction in EPSPs (○; EPSP slopes were 94.6 ± 6.3% of pre-LFS level at 30 min after LFS; p = 0.15; paired t test; n = 9 cells). However, LFS did cause significant spine shrinkage (▴; spine diameters were 81.2 ± 3.8% of baseline level at 30 min after LFS; p < 0.01; Wilcoxon's signed ranks test; n = 68 spines/7 cells). Calibration: A, 5 mV, 50 ms. Scale bar: A, 1 μm.
Figure 4.
Figure 4.
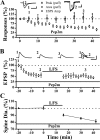
Trafficking of AMPARs induced by pep2m (or G10) does not cause spine shrinkage. A, Internal loading of the pep2m peptide caused depression of synaptic responses (○; peak EPSC amplitudes were 53.9 ± 6.6% of baseline level at 35 min after synaptic stimulation; p < 0.001; paired t test). However, responses to puffed glutamate was not altered in that both the peak (▴; 110.2 ± 15.3%; p = 0.49) and area (□; 104.6 ± 24.3%; p = 0.37; paired t test, at 35 min after synaptic stimulation; n = 4 cells) of glutamate-evoked response were not affected by pep2m. Neurons were held in voltage-clamp mode at −70 mV during these experiments and EPSCs were recorded. B , Synaptic depression caused by pep2m occluded the subsequent induction of LTD by LFS (EPSP slopes were 96.9 ± 10.4% of the level of the pep2m plateau; p = 0.78; paired t test; n = 7 cells). C, Spine shrinkage did not occur during the rapid synaptic depression but occurred after LFS. Calibration: A, left, 50 pA, 20 ms; right, 100 pA, 200 ms; B, 10 mV, 50 ms.
Figure 5.
Figure 5.
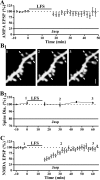
Induction of NMDAR-LTD leads to spine shrinkage. A, Bath perfusion of insulin did not alter NMDA-EPSPs, which was isolated using ACSF containing low Mg2+ (0.2 mm) and CNQX (10 μm) (n = 9 cells). B, Spine size was also not altered by bath application of insulin (n = 75 spines/7 cells). C, A sample experiment showing that both NMDA-EPSPs and spine size were reduced by LFS. Representative examples of NMDA-EPSPs (average of 5 consecutive traces) are also shown. Stable and shrinking spines are indicated by arrows and arrowheads, respectively. D, Population data showed that LFS induced significant and persistent reduction in NMDAR-EPSPs. E, Long-lasting reduction in spine size was also observed after LFS. F, Internal loading of the D15 peptide did not affect baseline NMDAR-EPSPs and LFS-induced NMDAR-LTD (peak amplitudes of NMDA-EPSPs were 49.1 ± 10.2% of baseline level at 45 min after LFS; p < 0.05; paired t test; n = 5 cells). G, Spine size was not altered by internal loading of the D15 peptide, but was reduced after LFS (spine diameters were 83.2 ± 2.4% of baseline level at 45 min after LFS; p < 0.05; Wilcoxon's signed ranks test; n = 48 spines/5 cells). This reduction was not different from the controls in E (p = 0.94, Mann–Whitney U test). Calibration: C, 2 mV, 50 ms. Scale bar, 1 μm.
Figure 6.
Figure 6.
NMDAR-LTD and spine shrinkage are independent processes. A, Inhibition of calcineurin signaling by internal loading of CsA, an inhibitor of protein phosphotase 2B, inhibited NMDAR-LTD (NMDA-EPSP peak amplitudes were 95.9 ± 10.2% of baseline level at 30 min after LFS; p = 0.82; paired t test; n = 12 cells). B, Spine shrinkage was also blocked by internal loading of cyclosporine A (spine diameters were 103.0 ± 3.7% of baseline level at 30 min after LFS; p = 0.81; Wilcoxon's signed ranks test; n = 81spines/7 cells). C, D, Inhibiting PP-1 signaling by internal loading of okadaic acid (OA) abolished both NMDAR-LTD (C) and LFS-induced spine shrinkage (D). E, Internal loading of the S3 peptide did not affect NMDAR-LTD. F, Spine shrinkage was inhibited by internal loading of the S3 peptide (spine diameters were 101.6 ± 3.4% of baseline level at 30 min after LFS; p > 0.05; Wilcoxon's signed ranks test; n = 63 spines/6 cells).
Figure 7.
Figure 7.
Actin depolymerization is required for both AMPAR-LTD and NMDAR-LTD. A, Internal loading of Jasp did not affect basal synaptic transmission but blocked LFS-induced AMPA-LTD. B, Spine shrinkage was abolished by internal loading of Jasp. A sample experiment (B1) and population data (B2) showed that spine size was unaltered by LFS in neurons loaded with Jasp (spine diameters were 103.6 ± 1.1% of baseline level at 30 min after LFS; p = 0.19; Wilcoxon's signed ranks test; n = 51 spines/5 cells). Clearly resolved spines were marked by arrows. C, NMDAR-LTD was also absent in neurons loaded with Jasp (NMDA-EPSP peaks were 94.6 ± 5.1% of baseline level at 30 min after LFS; p = 0.21; paired t test; n = 8 cells). Scale bar, 1 μm.

Similar articles

Cited by

References

    1. Allison DW, Gelfand VI, Spector I, Craig AM. Role of actin in anchoring postsynaptic receptors in cultured hippocampal neurons: differential attachment of NMDA versus AMPA receptors. J Neurosci. 1998;18:2423–2436. - PMC - PubMed
    1. Ashby MC, De La Rue SA, Ralph GS, Uney J, Collingridge GL, Henley JM. Removal of AMPA receptors (AMPARs) from synapses is preceded by transient endocytosis of extrasynaptic AMPARs. J Neurosci. 2004;24:5172–5176. - PMC - PubMed
    1. Beattie EC, Carroll RC, Yu X, Morishita W, Yasuda H, von Zastrow M, Malenka RC. Regulation of AMPA receptor endocytosis by a signaling mechanism shared with LTD. Nat Neurosci. 2000;3:1291–1300. - PubMed
    1. Borgdorff AJ, Choquet D. Regulation of AMPA receptor lateral movements. Nature. 2002;417:649–653. - PubMed
    1. Bredt DS, Nicoll RA. AMPA receptor trafficking at excitatory synapses. Neuron. 2003;40:361–379. - PubMed

Publication types

LinkOut - more resources