Comparative Study
. 2007 Nov 7;27(45):12367-77.
doi: 10.1523/JNEUROSCI.2786-07.2007.

Mechanisms of reversible GABAA receptor plasticity after ethanol intoxication

Affiliations
Comparative Study

Mechanisms of reversible GABAA receptor plasticity after ethanol intoxication

Jing Liang et al. J Neurosci. .

Abstract

The time-dependent effects of ethanol (EtOH) intoxication on GABA(A) receptor (GABA(A)R) composition and function were studied in rats. A cross-linking assay and Western blot analysis of microdissected CA1 area of hippocampal slices obtained 1 h after EtOH intoxication (5 g/kg, gavage), revealed decreases in the cell-surface fraction of alpha4 and delta, but not alpha1, alpha5, or gamma2 GABA(A)R subunits, without changes in their total content. This was accompanied (in CA1 neuron recordings) by decreased magnitude of the picrotoxin-sensitive tonic current (I(tonic)), but not miniature IPSCs (mIPSCs), and by reduced enhancement of I(tonic) by EtOH, but not by diazepam. By 48 h after EtOH dosing, cell-surface alpha4 (80%) and gamma2 (82%) subunit content increased, and cell-surface alpha1 (-50%) and delta (-79%) and overall content were decreased. This was paralleled by faster decay of mIPSCs, decreased diazepam enhancement of both mIPSCs and I(tonic), and paradoxically increased mIPSC responsiveness to EtOH (10-100 mm). Sensitivity to isoflurane- or diazepam-induced loss of righting reflex was decreased at 12 and 24 h after EtOH intoxication, respectively, suggesting functional GABA(A)R tolerance. The plastic GABA(A)R changes were gradually and fully reversible by 2 weeks after single EtOH dosing, but unexplainably persisted long after withdrawal from chronic intermittent ethanol treatment, which leads to signs of alcohol dependence. Our data suggest that early tolerance to EtOH may result from excessive activation and subsequent internalization of alpha4betadelta extrasynaptic GABA(A)Rs. This leads to transcriptionally regulated increases in alpha4 and gamma2 and decreases in alpha1 subunits, with preferential insertion of the newly formed alpha4betagamma2 GABA(A)Rs at synapses.


Figures
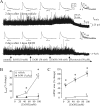
Figure 1.
Figure 1.
Decreased potentiation of the GABAAR-mediated tonic current and enhanced potentiation of mIPSCs by acute EtOH 2 d after withdrawal from a single intoxicating dose of EtOH. A, Examples of individual CA1 neuron recordings from vehicle-treated (top) and EtOH (5 g/kg)-treated rats (bottom traces). The Ihold needed to clamp the voltage at 0 mV before EtOH application is indicated by a dashed line. In a control recording, the kinetics of mIPSCs (top traces) averaged over the indicated 100 s periods during continuous recordings (bottom trace) are unaffected by 100 mm EtOH, whereas Ihold is visibly potentiated. Subsequent application of picrotoxin (50 μm) reveals the GABAAR-mediated tonic current component (Itonic). Two days after EtOH intoxication there is a loss of Ihold potentiation (bottom trace), whereas mIPSCs are visibly potentiated even by 10 mm EtOH. B, Ihold is significantly potentiated by acute application of 50 and 100 mm EtOH from vehicle-treated rats. Each point represents a mean ± SEM value from three to seven neurons (2–3 rats/group). C, From the same recordings as in B, mIPSCs from vehicle-treated rats are relatively insensitive to EtOH, whereas after EtOH intoxication mIPSCs are greatly potentiated by 10–100 mm EtOH. *p < 0.05 between vehicle and EtOH groups; p < 0.05 from pre-EtOH value (two-way repeated measures ANOVA).
Figure 2.
Figure 2.
Changes in acute EtOH sensitivity of synaptic and tonic GABAAR-currents after EtOH intoxication. A, Traces are superimposed averages of mIPSCs obtained from analysis of 100 s recording segments from CA1 neurons under basal conditions and after acute application of different [EtOH]. The numbers denote applied [EtOH] (mm). Note the faster decay of mIPSCs and the appearance of EtOH sensitivity 2 d after a single EtOH (5 g/kg) dose. Sensitivity to EtOH disappears 14 d later. In contrast, mIPSCs from a CIE-treated rat decay faster and maintain EtOH sensitivity even after long-term withdrawal. B, Graph of acute EtOH effect (100 mm) on mIPSC charge transfer in hippocampal slices from rats treated with a single dose of saline, EtOH, or CIE. Data are mean ± SEM of values from three to eight neurons obtained at 1 h, 12 h, and 2, 4, 7, 14, and 120 d after respective treatments. Note the lack of mIPSC potentiation by EtOH after saline treatment and the significant (*p < 0.05, one-way ANOVA) reversible potentiation first observed at 12 h, but not at 1 h after a single intoxicating EtOH dose. C, Graph of acute EtOH effect on the tonic Ihold from the same recordings as in B. Note the reversible loss of Ihold responsiveness to acute EtOH first observed at 1 h after a single dose EtOH treatment. Tolerance to the Ihold potentiation by acute EtOH persists after long-term withdrawal from CIE treatment.
Figure 3.
Figure 3.
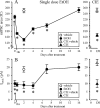
Time course of changes in mIPSC charge transfer and tonic current magnitude after EtOH intoxication. A, Graph of the mIPSC charge transfer recorded in the absence of added allosteric modulators at various times after EtOH intoxication. Data are mean ± SEM of values from three to 10 neurons obtained at 1 h, 12 h, and 2, 4, 7, 14, and 120 d after respective treatments. *p < 0.05 from vehicle-treated controls (one-way ANOVA). Note the progressive decrease in mIPSC charge transfer after EtOH intoxication, which peaks at 2 d and recovers by 14 d, unlike mIPSCs from CIE rats. B, Graph of time-dependent changes in the picrotoxin-sensitive tonic current (Itonic) after EtOH intoxication. Data are mean ± SEM of values from three to nine neurons obtained at 1 h, 12 h, and 2, 4, 7, 14, and 120 d after respective treatments. *p < 0.05 from vehicle-treated controls (one-way ANOVA). Note that Itonic is already reduced at 1 h after EtOH intoxication. Itonic remains diminished after long-term withdrawal from CIE treatment.
Figure 4.
Figure 4.
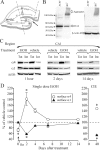
Reversible changes in α4 and α1 subunit proteins in microdissected CA1 region after single EtOH dosing. A, Schematic of slice microdissection procedures. Dashed lines represent microblade cuts. Arrow points to the hippocampal fissure. B, Examples of gels from the microdissected CA1 region incubated with ACSF or with the BS3 cross-linking reagent. BS3-linked cell-surface α4 protein is present as high molecular weight aggregates (arrow) that do not reliably enter the gel. In contrast, gel migration of the intracellular protein β-actin is unaffected. C, Western blots of α4 and α1 subunit protein at 1 h and 2 and 14 d after a single dose of vehicle or EtOH (5 g/kg; gavage). β-Actin was used as a loading control. Tot, Total protein (incubation with ACSF); Int, intracellular protein fraction (incubation with BS3). Note the increased α4 intracellular signal at 1 h after EtOH. At 2 d after EtOH, the Tot lane α4 increases and α1 signal decreases compared with vehicle. These differences are not seen at 14 d. D, Summary graph of changes in cell-surface α4 and α1 subunit content after single dose EtOH and CIE treatments relative to vehicle-treated controls (dashed line). Data are mean ± SEM from vehicle, single dose EtOH, or CIE treatments (n = 4–5 rats/treatment). *p < 0.05 (t test) compared with vehicle-treated controls. Note the persistence of changes after long-term withdrawal from CIE treatment.
Figure 5.
Figure 5.
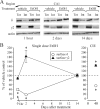
Reversible changes in δ and γ2 subunit proteins in microdissected CA1 region after single EtOH dosing. A, Examples of Western blots of δ and γ2 subunits at 1 h and 2 and 14 d after a single dose of vehicle or EtOH (5 g/kg, gavage). β-Actin was used as a loading control. Tot, Total protein (incubation with ACSF); Int, intracellular protein fraction (incubation with BS3). Note the large increases in the intracellular δ signal at 1 h and 2 d after EtOH. In contrast, a large increase in the total γ2 signal is seen at 2 d after EtOH compared with vehicle. These differences are not seen at 14 d. B, Summary graph of changes in cell-surface δ and γ2 subunit content after single dose EtOH and CIE treatments relative to vehicle-treated controls (dashed line). Data are mean ± SEM from vehicle, single dose EtOH, or CIE treatments (n = 4–5 rats/treatment). *p < 0.05 (t test) compared with vehicle-treated controls. Note that the subunit alterations are maintained long after withdrawal from CIE treatment.
Figure 6.
Figure 6.
Minor changes in α5 subunit protein in microdissected CA1 region after single EtOH dosing. Examples of α5 subunit Western blots at 1 h and 2 and 14 d after a single dose of vehicle or EtOH (5 g/kg, gavage) are shown. β-Actin was used as a loading control. Tot, Total protein (incubation with ACSF); Int, intracellular protein fraction (incubation with BS3). Calculated cell surface α5 subunit levels were at 1 h (117 ± 4%; n.s., n = 4), at 2 d (127 ± 4%; p < 0.05, n = 4), and at 14 d (116 ± 2%; n.s., n = 4) of vehicle controls. Note the absence of differences in the Tot lane optical densities, whereas small decreases in the intracellular protein fractions account for the changes in cell-surface subunit content after EtOH intoxication.
Figure 7.
Figure 7.
Time course of changes in diazepam sensitivity of synaptic and tonic GABAAR-currents after EtOH treatment. A, Traces are superimposed averages of mIPSCs obtained from analysis of 100 s recording segments from CA1 neurons under basal conditions and after acute application of DZ (3 μm). The numbers denote applied [DZ] (μm). Note the faster decay of mIPSCs and the loss of DZ sensitivity at 2 d, but not 1 h, after a single EtOH (5 g/kg) dose. Sensitivity to DZ is fully restored 14 d later. In contrast, mIPSCs from a CIE-treated rat decay faster and remain DZ-insensitive even after long-term withdrawal. B, Graph of acute DZ effect on mIPSC charge transfer in hippocampal slices from rats treated with a single dose of vehicle, EtOH, or CIE. Data are mean ± SEM of values from three to 10 neurons obtained at 1 h and 2, 4, 7, 14, and 40 d after respective treatments. Note the reversible reduction of mIPSC potentiation by DZ at 2 d, but not at 1 h after a single intoxicating EtOH dose. C, Graph of DZ effect on the picrotoxin-sensitive tonic current (Itonic) from the same recordings as in B. Note the maintained Itonic responsiveness to DZ at 1 h, followed by a large decrease at 2 d and gradual recovery by 14 d after single dose EtOH intoxication. Tolerance to the Itonic potentiation by DZ persists long after withdrawal from CIE treatment. *p < 0.05 (one-way ANOVA or t test) compared with vehicle-treated controls.
Figure 8.
Figure 8.
EtOH dose dependence of diazepam cross-tolerance. A, B, Plasma [EtOH] after intragastric (5 g/kg, open circles) or intraperitoneal (3 g/kg, closed triangles) administration. Data are shown from 1 rat/dose for clarity. Note the high peak plasma [EtOH] achieved within 2 min after intraperitoneal injection compared with the slow LORR duration (B; mean ± SEM) induced by diazepam (10 mg/kg, i.p.) in rats (n = 5–7/point) treated 24 h previously with different doses of EtOH (0–5 g/kg, gavage). Note the complete lack of tolerance to diazepam with EtOH doses ≤2.0 g/kg. *p < 0.05 (one-way ANOVA or t test) compared with vehicle-treated controls.
Figure 9.
Figure 9.
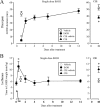
A, B, Time course of diazepam (A) and isoflurane (B) tolerance after single dose EtOH intoxication. A, Each point is mean ± SEM of LORR duration values obtained from rats (n = 5–12/point) after a single dose of vehicle, EtOH (5 g/kg, gavage) or CIE treatments followed at 1, 2, 4, 7, 14, or 40 d by diazepam (10 mg/kg, i.p.). Note the profound tolerance to diazepam at 1 d after EtOH intoxication with gradual recovery by 2 weeks. Significant tolerance to DZ persists long after withdrawal from CIE treatment. B, Each point is mean ± SEM of time to LORR values obtained from rats (n = 4–5/group) exposed to isoflurane at 1, 2, 4, 7, or 14 d after a single dose of vehicle or EtOH (5 g/kg, gavage), or 40 d after CIE treatment. *p < 0.05 (one-way ANOVA or t test) compared with vehicle-treated controls.
Figure 10.
Figure 10.
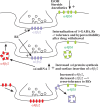
Schematic of hypothesized mechanism of EtOH-induced GABAAR plasticity. High [EtOH] exposure leads to internalization of overactivated extrasynaptic receptors (i.e., α4β3δ, green) which may explain the acute functional tolerance to EtOH and the decreased magnitude of tonic currents. Compensation is by insertion of the readily inducible α4βγ2 GABAARs (red) from intracellular stores. The increased surface α4βγ2 inserted exocytotically at extrasynaptic sites, quickly moves into the synaptic membrane by mass action, changing the kinetics and pharmacology of mIPSCs. The α1βγ2 pentamers (purple) are removed from the surface synaptic, and also to some extent extrasynaptic, pools because of crowding out by α4βγ2. This switch from α1- to α4-containing GABAARs results in cross-tolerance to benzodiazepines (BZ) and alters mIPSC kinetics. Thus, the GABAAR α4 participates in a critical compensation, serving as an emergency brake, but the new GABAARs have physiological properties different from normal and are “less functional” under certain conditions.

Similar articles

Cited by

References

    1. Ali NJ, Olsen RW. Chronic benzodiazepine treatment of cells expressing recombinant GABAA receptors uncouples allosteric binding: studies on possible mechanisms. J Neurochem. 2001;79:1100–1108. - PubMed
    1. Bai D, Zhu G, Pennefather P, Jackson MF, MacDonald JF, Orser BA. Distinct functional and pharmacological properties of tonic and quantal inhibitory postsynaptic currents mediated by γ-aminobutyric acid(A) receptors in hippocampal neurons. Mol Pharmacol. 2001;59:814–824. - PubMed
    1. Bayard M, McIntyre J, Hill KR, Woodside J., Jr Alcohol withdrawal syndrome. Am Fam Physician. 2004;69:1443–1450. - PubMed
    1. Besheer J, Cox AA, Hodge CW. Coregulation of ethanol discrimination by the nucleus accumbens and amygdala. Alcohol Clin Exp Res. 2003;27:450–456. - PubMed
    1. Bieda MC, MacIver MB. Major role for tonic GABAA conductances in anesthetic suppression of intrinsic neuronal excitability. J Neurophysiol. 2004;92:1658–1667. - PubMed

Publication types

MeSH terms

LinkOut - more resources