Peptide conformation and supramolecular organization in amylin fibrils: constraints from solid-state NMR
- PMID: 17979302
- PMCID: PMC2562526
- DOI: 10.1021/bi701427q
Peptide conformation and supramolecular organization in amylin fibrils: constraints from solid-state NMR
Abstract
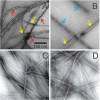
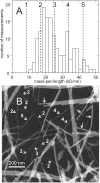
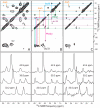
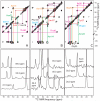
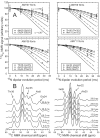
The 37-residue amylin peptide, also known as islet amyloid polypeptide, forms fibrils that are the main peptide or protein component of amyloid that develops in the pancreas of type 2 diabetes patients. Amylin also readily forms amyloid fibrils in vitro that are highly polymorphic under typical experimental conditions. We describe a protocol for the preparation of synthetic amylin fibrils that exhibit a single predominant morphology, which we call a striated ribbon, in electron microscopy and atomic force microscopy images. Solid-state nuclear magnetic resonance (NMR) measurements on a series of isotopically labeled samples indicate a single molecular structure within the striated ribbons. We use scanning transmission electron microscopy and several types of one- and two-dimensional solid-state NMR techniques to obtain constraints on the peptide conformation and supramolecular structure in these amylin fibrils and to derive molecular structural models that are consistent with the experimental data. The basic structural unit in amylin striated ribbons, which we call the protofilament, contains four layers of parallel beta-sheets, formed by two symmetric layers of amylin molecules. The molecular structure of amylin protofilaments in striated ribbons closely resembles the protofilament in amyloid fibrils with a similar morphology formed by the 40-residue beta-amyloid peptide that is associated with Alzheimer's disease.
Figures





Similar articles
-
Supramolecular structural constraints on Alzheimer's beta-amyloid fibrils from electron microscopy and solid-state nuclear magnetic resonance.Biochemistry. 2002 Dec 24;41(51):15436-50. doi: 10.1021/bi0204185. Biochemistry. 2002. PMID: 12484785
-
Structural insights into the polymorphism of amyloid-like fibrils formed by region 20-29 of amylin revealed by solid-state NMR and X-ray fiber diffraction.J Am Chem Soc. 2008 Nov 12;130(45):14990-5001. doi: 10.1021/ja802483d. Epub 2008 Oct 21. J Am Chem Soc. 2008. PMID: 18937465
-
Amyloid fibril formation by A beta 16-22, a seven-residue fragment of the Alzheimer's beta-amyloid peptide, and structural characterization by solid state NMR.Biochemistry. 2000 Nov 14;39(45):13748-59. doi: 10.1021/bi0011330. Biochemistry. 2000. PMID: 11076514
-
Molecular structure of amyloid fibrils: insights from solid-state NMR.Q Rev Biophys. 2006 Feb;39(1):1-55. doi: 10.1017/S0033583506004173. Epub 2006 Jun 13. Q Rev Biophys. 2006. PMID: 16772049 Review.
-
Backbone-modified amylin derivatives: implications for amyloid inhibitor design and as template for self-assembling bionanomaterials.J Pept Sci. 2007 Nov;13(11):709-16. doi: 10.1002/psc.831. J Pept Sci. 2007. PMID: 17890652 Review.
Cited by
-
Toxic species in amyloid disorders: Oligomers or mature fibrils.Ann Indian Acad Neurol. 2015 Apr-Jun;18(2):138-45. doi: 10.4103/0972-2327.144284. Ann Indian Acad Neurol. 2015. PMID: 26019408 Free PMC article. Review.
-
Inhibition of IAPP aggregation by insulin depends on the insulin oligomeric state regulated by zinc ion concentration.Sci Rep. 2015 Feb 4;5:8240. doi: 10.1038/srep08240. Sci Rep. 2015. PMID: 25649462 Free PMC article.
-
Computational assembly of polymorphic amyloid fibrils reveals stable aggregates.Biophys J. 2013 Feb 5;104(3):683-93. doi: 10.1016/j.bpj.2012.12.037. Biophys J. 2013. PMID: 23442919 Free PMC article.
-
Amyloid formation in heterogeneous environments: islet amyloid polypeptide glycosaminoglycan interactions.J Mol Biol. 2013 Feb 8;425(3):492-505. doi: 10.1016/j.jmb.2012.11.003. Epub 2012 Nov 12. J Mol Biol. 2013. PMID: 23154166 Free PMC article.
-
Enlightening amyloid fibrils linked to type 2 diabetes and cross-interactions with Aβ.Nat Struct Mol Biol. 2020 Nov;27(11):1006-1008. doi: 10.1038/s41594-020-00523-z. Nat Struct Mol Biol. 2020. PMID: 33097922 No abstract available.
References
-
- Gedulin BR, Jodka CM, Herrmann K, Young AA. Role of endogenous amylin in glucagon secretion and gastric emptying in rats demonstrated with the selective antagonist, AC187. Regul. Pept. 2006;137:121–127. - PubMed
-
- Westermark P, Wernstedt C, Wilander E, Hayden DW, Obrien TD, Johnson KH. Amyloid fibrils in human insulinoma and islets of Langerhans of the diabetic cat are derived from a neuropeptide like protein also present in normal islet cells. Proc. Natl. Acad. Sci. U. S. A. 1987;84:3881–3885. - PMC - PubMed
-
- Lorenzo A, Razzaboni B, Weir GC, Yankner BA. Pancreatic islet cell toxicity of amylin associated with type 2 diabetes mellitus. Nature. 1994;368:756–760. - PubMed
-
- Kahn SE. The relative contributions of insulin resistance and beta-cell dysfunction to the pathophysiology of type 2 diabetes. Diabetologia. 2003;46:3–19. - PubMed
Publication types
MeSH terms
Substances
Grants and funding
LinkOut - more resources
Full Text Sources
Miscellaneous

