. 2007 Oct 31;27(44):12033-44.
doi: 10.1523/JNEUROSCI.2282-07.2007.

The FGF14(F145S) mutation disrupts the interaction of FGF14 with voltage-gated Na+ channels and impairs neuronal excitability

Affiliations

The FGF14(F145S) mutation disrupts the interaction of FGF14 with voltage-gated Na+ channels and impairs neuronal excitability

Fernanda Laezza et al. J Neurosci. .

Abstract

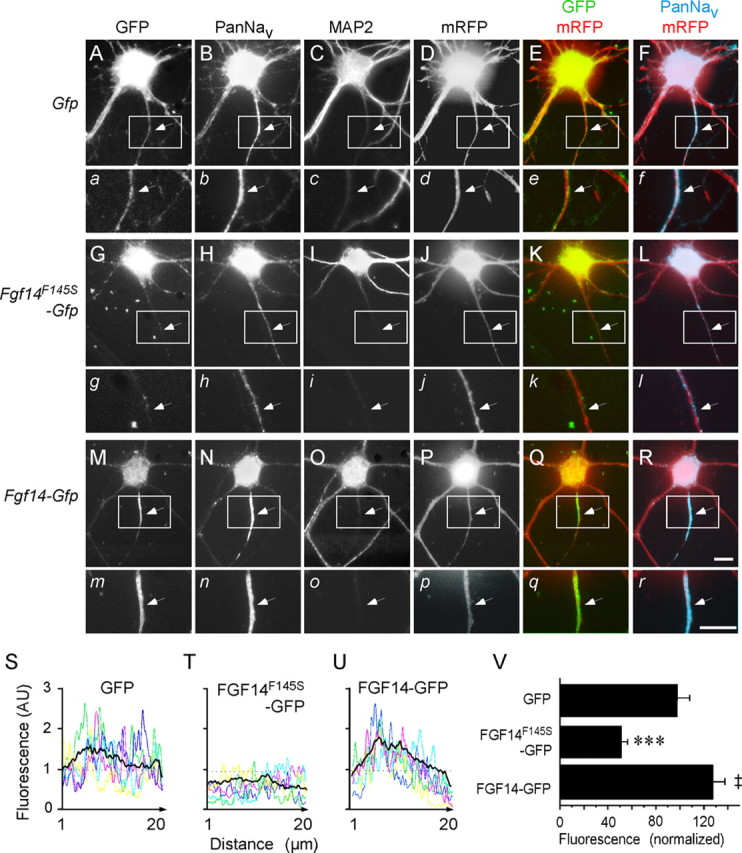
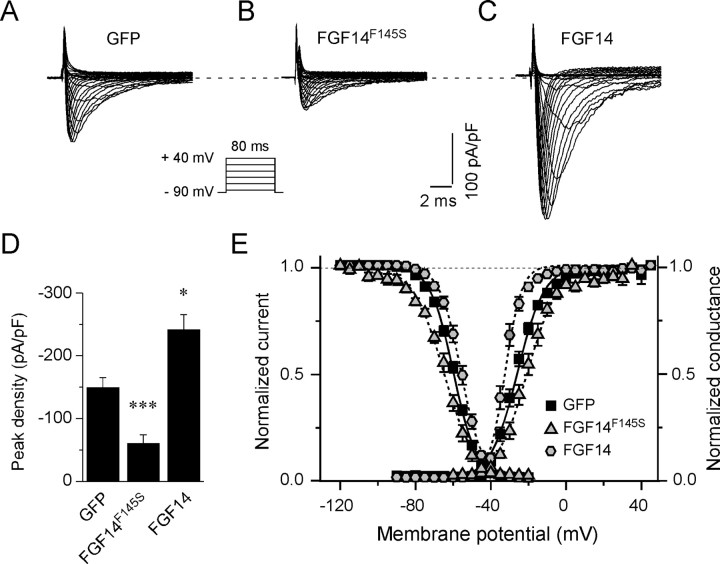
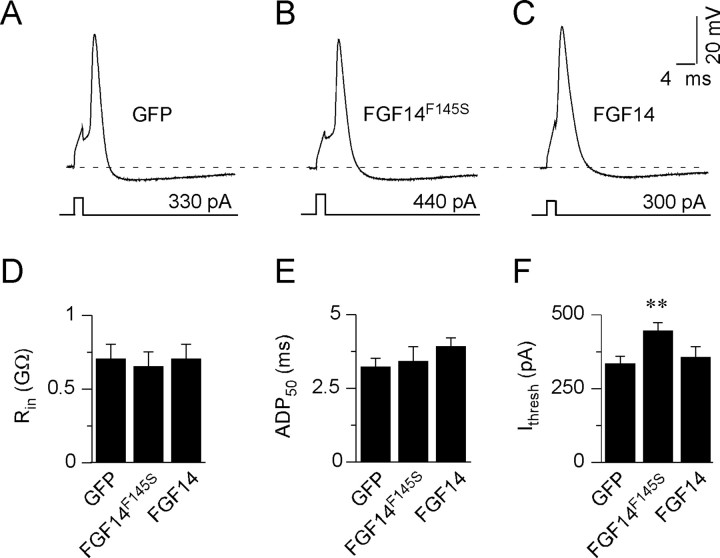
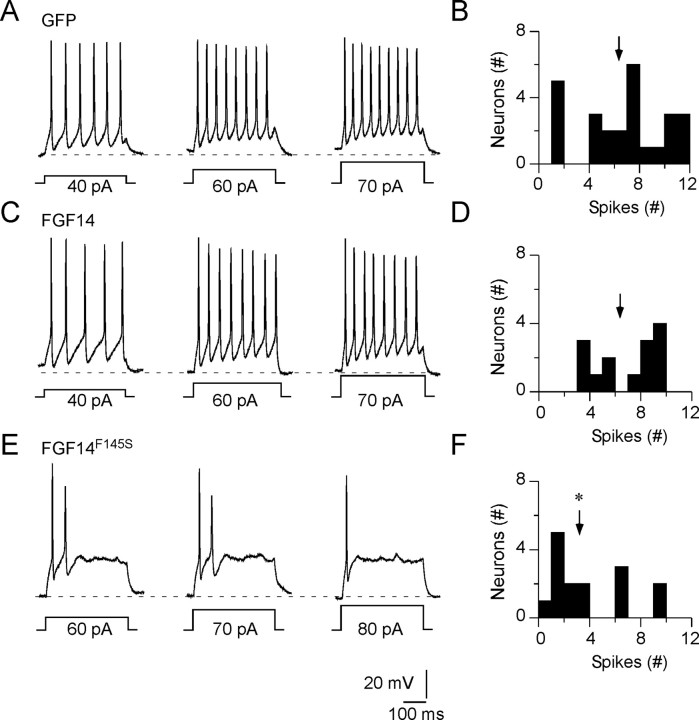
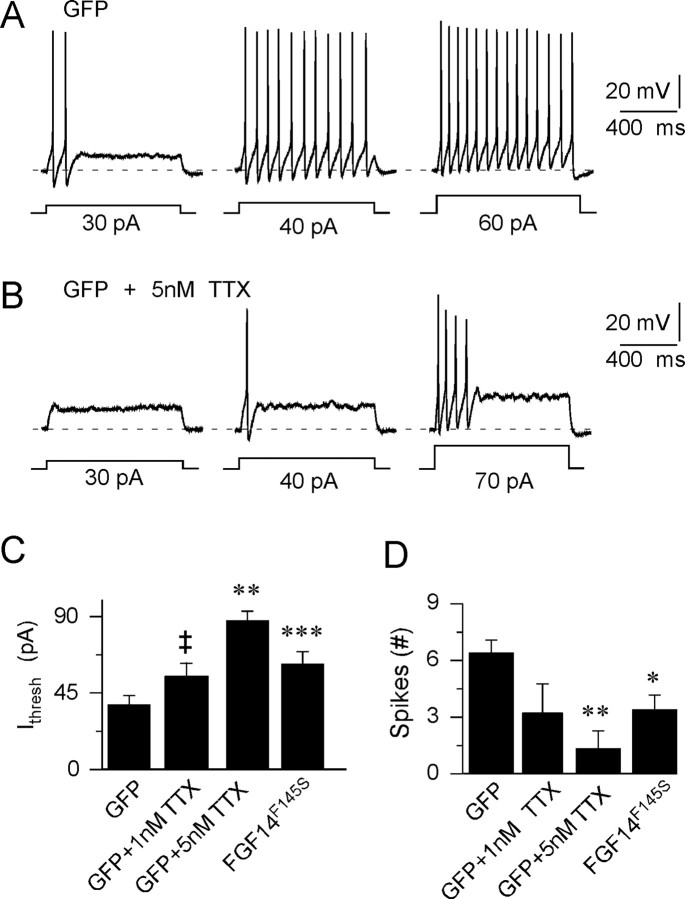
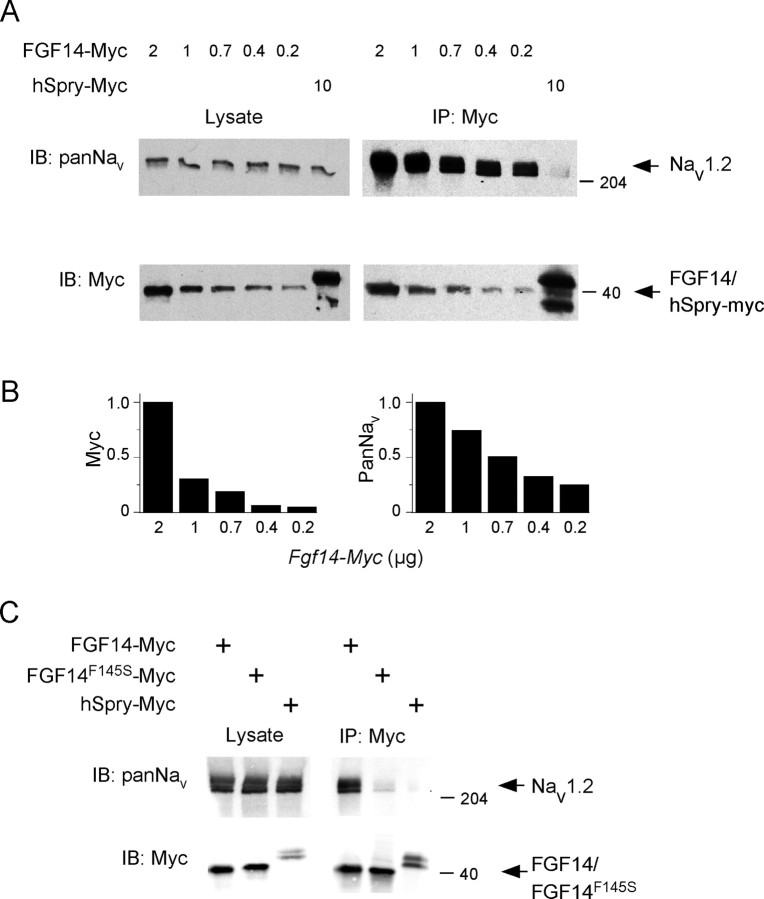
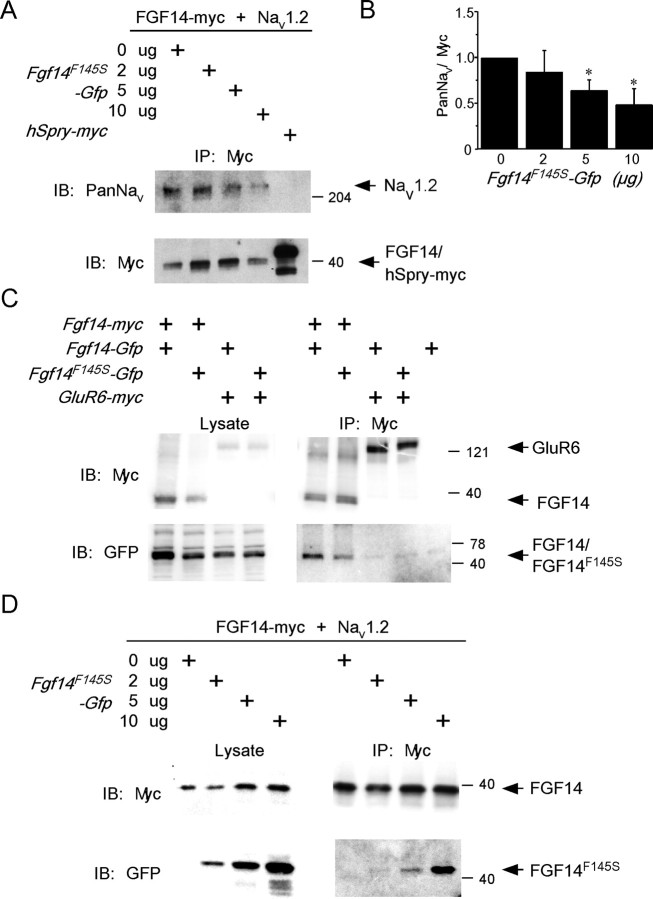
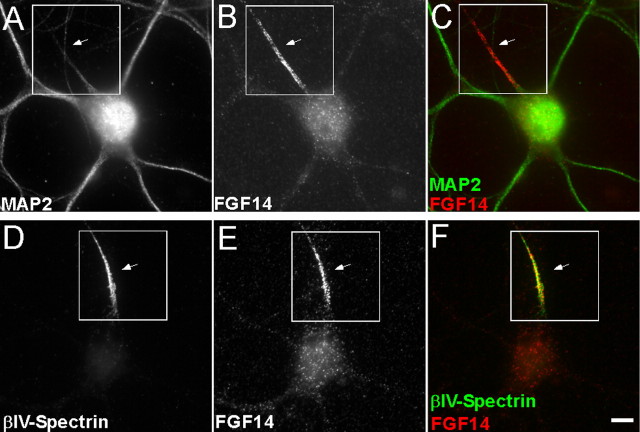
Fibroblast growth factor 14 (FGF14) belongs to the intracellular FGF homologous factor subfamily of FGF proteins (iFGFs) that are not secreted and do not activate tyrosine kinase receptors. The iFGFs, however, have been shown to interact with the pore-forming (alpha) subunits of voltage-gated Na+ (Na(v)) channels. The neurological phenotypes seen in Fgf14-/- mice and the identification of an FGF14 missense mutation (FGF14(F145S)) in a Dutch family presenting with cognitive impairment and spinocerebellar ataxia suggest links between FGF14 and neuronal functioning. Here, we demonstrate that the expression of FGF14(F145S) reduces Na(v) alpha subunit expression at the axon initial segment, attenuates Na(v) channel currents, and reduces the excitability of hippocampal neurons. In addition, and in contrast with wild-type FGF14, FGF14(F145S) does not interact directly with Na(v) channel alpha subunits. Rather, FGF14(F145S) associates with wild-type FGF14 and disrupts the interaction between wild-type FGF14 and Na(v) alpha subunits, suggesting that the mutant FGF14(F145S) protein acts as a dominant negative, interfering with the interaction between wild-type FGF14 and Na(v) channel alpha subunits and altering neuronal excitability.


Figures

Figure 1.
Figure 1.
Nav channel localization at the AIS is disrupted by expression of FGF14F145S. A–R, Fluorescence images of rat hippocampal neurons expressing mRFP together with GFP (A–F), FGF14F145S-GFP (G–L), or FGF14-GFP (M–R) stained with a monoclonal anti-Nav α subunit-specific antibody, PanNav, visualized with an Alexa 647-conjugated secondary antibody (B, H, N), and a polyclonal anti-MAP2 antibody, visualized with an AMCA-conjugated secondary antibody (C, I, O). GFP fluorescence images are shown in A, G, and M, and mRFP fluorescence images are shown in D, J, and P. Overlay images of GFP and mRFP are shown in the green and red channels (E, K, Q). Overlay images of PanNav and mRFP are shown in cyan and red channels (F, L, R). The bottom panels (a–r) are high-magnification images of the boxed regions in each of the corresponding panels A–R, presented to highlight the AIS regions (arrows). Comparing B, H, and N, it is evident that the intensity of the Nav α subunit labeling in the AIS regions is lower in the FGF14F145S-expressing neuron (H) and is higher in the FGF14-expressing neuron (N) than in the cell expressing GFP (B). Scale bars, 10 μm. S–U, Representative examples of Nav α subunit immunofluorescence intensity line scans along the AIS regions in individual neurons expressing GFP (S), FGF14F145S-GFP (T), or FGF14-GFP (U). In each panel, the black line indicates the mean fluorescence intensity profile obtained from GFP-expressing (S; n = 20), FGF14F145S-GFP-expressing (T; n = 23), or FGF14-GFP-expressing (U; n = 28) neurons from one set of transfections. V, Mean ± SEM of Nav α subunit immunofluorescence intensities in GFP-expressing (n = 40), FGF14F145S-GFP-expressing (n = 47), and FGF14-GFP-expressing (n = 58) cells are plotted. Values were normalized to the mean control value determined in GFP-expressing cells (p < 0.05; ***p < 0.001).
Figure 2.
Figure 2.
Expression of FGF14F145S attenuates peak Nav current densities in hippocampal neurons. A–C, Representative whole-cell voltage-gated inward Na+ (Nav) currents recorded from isolated hippocampal neurons in response to depolarizing voltage steps to potentials ranging from −60 to +40 mV from a holding potential of −90 mV as described in Materials and Methods. The voltage-clamp protocol is illustrated below the current records. D, Mean ± SEM peak Nav current densities in hippocampal neurons expressing FGF14F145S-GFP (n = 29) are significantly (***p < 0.001) lower than in cells expressing GFP (n = 38), whereas mean ± SEM peak Nav current densities in FGF14-GFP (n = 17)-expressing cells are significantly (*p < 0.01) higher. E, Small but statistically significant (**p < 0.005) differences in the voltage dependences of Nav channel activation and inactivation are evident in cells overexpressing FGF14 and in cells expressing FGF14F145S compared with cells expressing only GFP (see also Table 1).
Figure 3.
Figure 3.
Expression of FGF14F145S reduces the excitability of hippocampal neurons. A–C, Single action potentials, evoked by brief (2 ms) depolarizing current injections, were recorded from isolated (rat) hippocampal neurons expressing GFP (A), FGF14F145S-GFP (B), or FGF14-GFP (C), as described in Materials and Methods. The amplitudes and durations of the injected currents are illustrated below the voltage records. Although larger-amplitude currents were required to evoke action potentials in FGF14F145S-GFP-expressing cells (B) compared with FGF14-GFP-expressing (C) and GFP-expressing (A) cells, action potentials in all cells are brief and afterhyperpolarizations are pronounced. In addition, there are no significant differences in the waveforms of the action potentials in cells expressing FGF14F145S-GFP (B) compared with cells expressing wild-type FGF14-GFP (C) or GFP (A). D, E, The input resistances (D) and the durations of single action potentials, measured at 50% repolarization (APD50) (E), in FGF14F145S-GFP-, FGF14-GFP-, and GFP-expressing cells are indistinguishable. F, The mean ± SEM current (Ithresh) required to elicit single action potentials, however, was significantly (**p < 0.005) higher in cells expressing FGF14F145S-GFP (n = 13) compared with cells expressing GFP (n = 25) or wild-type FGF14-GFP (n = 8).
Figure 4.
Figure 4.
Expression of FGF14F145S attenuates repetitive firing in hippocampal neurons. Repetitive firing in isolated hippocampal neurons expressing GFP (A), FGF14-GFP (C), or FGF14F145S-GFP (E) was evoked in response to prolonged (500 ms) depolarizing current injections, as described in Materialss and Methods. Representative examples are illustrated, and the amplitudes of the injected currents are illustrated below the voltage records. A, Hippocampal neurons expressing GFP typically fire repetitively and at rates that vary with the amplitude of the injected current. B, Distribution of maximal number of action potentials evoked in individual GFP-expressing cells (n = 27) during 500 ms, 90 pA current injections. C, The repetitive firing properties of cells expressing FGF14-GFP are similar (to those of cells expressing GFP), with average firing rates increasing with the stimulus intensity. D, The distribution of the maximal number of evoked action potentials in FGF14-GFP-expressing cells (n = 13) is similar to cells expressing GFP (B). E, Repetitive firing is attenuated markedly in neurons expressing FGF14F145S (n = 16), and repetitive firing rates in most FGF14F145S-expressing cells do not increase substantially in response to increasing the amplitudes of the injected currents. F, Histogram showing the distribution of the maximal numbers of action potentials fired (during 500 ms depolarizing 90 pA current injections) in FGF14F145S-GFP-expressing cells is skewed to the left (fewer action potentials) compared with cells expressing GFP (B) or FGF14-GFP (D). The mean number of action potentials evoked in FGF14F145S-GFP-expressing cells is significantly (*p < 0.01) lower than in GFP or FGF14-GFP expressing cells. Arrows in B, D, and F indicate the mean number of action potentials elicited in response to 500 ms, 90 pA current injections.
Figure 5.
Figure 5.
Application of low concentrations of TTX reduces excitability and attenuates repetitive firing in hippocampal neurons, mimicking the effects of FGF14F145S expression. Action potentials were recorded, as described in the legend to Figure 4, from GFP-expressing (wild-type) hippocampal neurons before and after local applications of 1–5 nm TTX. A, Representative action potentials recorded from a GFP-expressing hippocampal pyramidal neuron in response to increasing depolarizing current injections. B, After application of 5 nm TTX, more current was required to evoke action potentials to fire, and repetitive firing was reduced. C, D, The effects of TTX on firing properties are similar to those seen in cells expressing FGF14F145S-GFP. The mean ± SEM (n = 4) current (C) required to evoke action potentials was increased significantly (**p < 0.01; ***p < 0.001), whereas the mean ± SEM number of spikes (D) evoked (during 1 s depolarizing current injections) was reduced significantly (*p < 0.01); **p < 0.01 in GFP-expressing cells exposed to 5 nm TTX. Exposure to 1 nm TTX (n = 4) also increased the mean ± SEM current required to evoke action potentials (p = 0.05) in GFP-expressing cells. Repetitive firing was also reduced after exposure to 1 nm TTX, although the mean ± SEM number of spikes evoked was not statistically lower than control. The mean ± SEM current required to evoke action potentials (C) and the mean ± SEM maximal number of spikes evoked during 1 s depolarizing current injections in FGF14F145S-expressing cells (D) are plotted here for comparison.
Figure 6.
Figure 6.
FGF14F145S does not interact directly with Nav α subunits. A, HEK-Nav1.2 cells were transiently transfected with varying concentrations (2–0.2 μg) of Fgf14-myc or with the (negative) control plasmid hSpry-myc (10 μg). Western blots of whole-cell lysates (left panels) revealed a constant level of Nav1.2 expression and variable levels of expression of FGF14-myc, paralleling the concentrations of Fgf14-myc used in the transfection (left). After immunoprecipitation of cell extracts with anti-myc agarose beads (IP: Myc), immunoblots (IB) were probed with either an anti-myc or an anti-Pan Nav α subunit antibody (right). As is evident, Nav1.2 coimmunoprecipitates with the anti-myc agarose beads from cells expressing FGF14-myc but not from cells expressing hSpry-myc. B, In addition, quantification of the relative intensities of the anti-myc and anti-Nav1.2 bands from the Western blots of the coimmunoprecipitated (Nav1.2 and FGF14) proteins revealed parallel efficiencies as a function of the amount of Fgf14-myc used in the transfections. C, HEK-Nav1.2 cells were transiently transfected with Fgf14-myc, FGF14F145S-myc, or with the hSpry-myc control plasmid. Western blots of lysates from these cells (left) revealed uniform levels of Nav1.2 and robust expression of FGF14-myc, FGF14F145S-myc, or hSpry-myc. After immunoprecipitations with anti-myc beads (IP: Myc), immunoblots (IB) were performed (right) using the anti-myc or anti-Pan Nav α subunit antibodies. In contrast to FGF14-myc (A), Nav1.2 was not coimmunoprecipitated from cells expressing FGF14F145S-myc (or hSpry-myc) using anti-myc agarose beads.
Figure 7.
Figure 7.
FGF14F145S disrupts the interaction between FGF14 and Nav1.2 and coimmunoprecipitates with wild-type FGF14. A, HEK-Nav1.2 cells were transiently transfected with Fgf14-myc and increasing amounts of FGF14F145S-Gfp or with the (negative) control hSpry-myc construct. After immunoprecipitation with anti-myc agarose beads (IP: Myc), immunoblots (IB) were performed with either the anti-Pan Nav α subunit or the anti-myc monoclonal antibody (left). As is evident, increasing the amount of FGF14F145S–GFP reduced the amount of Nav1.2 that coimmunoprecipitated with the anti-myc beads (FGF14). As was also illustrated in Figure 6, Nav1.2 does not coimmunoprecipitate with hSpry-myc. B, Densitometric ratio of coimmunoprecipitated Nav1.2/FGF14-myc plotted as a function of the FGF14F145S-Gfp used in the transfections. These analyses revealed that increasing the amount of FGF14F145S-Gfp significantly (*p < 0.01) reduced the amount of Nav1.2 coprecipitating with anti-myc agarose beads. C, HEK-293 cells were transiently transfected with Fgf14-myc (or with the control plasmid myc-GluR6) and either Fgf14-Gfp or FGF14F145S-Gfp. Western blots of whole-cell lysates (left) confirmed expression of the tagged constructs. Whole-cell lysates were immunoprecipitated with anti-myc agarose beads (IP: Myc), and immunoblots (IB) were performed using either the anti-myc or anti-GFP antibody (right). Both FGF14-GFP and FGF14F145S-GFP were coimmunoprecipitated with the myc-tagged FGF14. The association appears to be specific for FGF14 because myc-GluR6 did not coimmunoprecipitate with either FGF14-GFP or FGF14F145S-GFP. D, The interaction between FGF14F145S-GFP and FGF14-myc was also evident in the presence of Nav1.2. HEK-Nav1.2 cells were transiently transfected with Fgf14-myc and with increasing concentrations of FGF14F145S-Gfp. Western blots of lysates from these cells (left) revealed expression of FGF14-myc and increasing concentrations of FGF14F145S-GFP. In addition, FGF14F145S-GFP was coimmunoprecipitated with FGF14-myc from these cells (IP: Myc) using anti-myc agarose beads (right).
Figure 8.
Figure 8.
Endogenous FGF14 is readily detected in isolated rat hippocampal neurons, concentrated in the AIS. Fluorescence images of rat hippocampal neurons at 14 DIV show double labeling for FGF14 and either MAP2 (A–C) or βIV-spectrin (D–F). FGF14 is shown in red, whereas MAP2 and βIV-spectrin are shown in green in the overlay images in C and F. As is evident, FGF14 staining was present in MAP2-negative processes (C), colocalized with βIV-spectrin (F) at the AIS (arrows). Scale bar, 10 μm.

Similar articles

Cited by

References

    1. Bechtold DA, Smith KJ. Sodium-mediated axonal degeneration in inflammatory demyelinating disease. J Neurol Sci. 2005;233:27–35. - PubMed
    1. Catterall WA. From ionic currents to molecular mechanisms: the structure and function of voltage-gated sodium channels. Neuron. 2000;26:13–25. - PubMed
    1. Catterall WA, Goldin AL, Waxman SG. International Union of Pharmacology. XLVII. Nomenclature and structure-function relationships of voltage-gated sodium channels. Pharmacol Rev. 2005;57:397–409. - PubMed
    1. Clark B, Hausser M. Neural coding: hybrid analog and digital signalling in axons. Curr Biol. 2006;16:R585–R588. - PubMed
    1. Clark BA, Monsivais P, Branco T, London M, Hausser M. The site of action potential initiation in cerebellar Purkinje neurons. Nat Neurosci. 2005;8:137–139. - PubMed

Publication types

MeSH terms

LinkOut - more resources