. 2007 Oct 22;179(2):291-304.
doi: 10.1083/jcb.200706018.

The transcriptional cycle of HIV-1 in real-time and live cells

Affiliations

The transcriptional cycle of HIV-1 in real-time and live cells

Stéphanie Boireau et al. J Cell Biol. .

Abstract

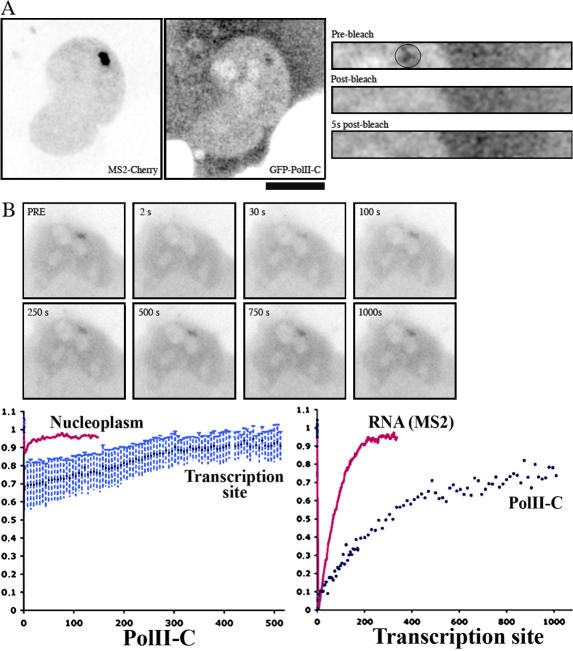
RNA polymerase II (RNAPII) is a fundamental enzyme, but few studies have analyzed its activity in living cells. Using human immunodeficiency virus (HIV) type 1 reporters, we study real-time messenger RNA (mRNA) biogenesis by photobleaching nascent RNAs and RNAPII at specific transcription sites. Through modeling, the use of mutant polymerases, drugs, and quantitative in situ hybridization, we investigate the kinetics of the HIV-1 transcription cycle. Initiation appears efficient because most polymerases demonstrate stable gene association. We calculate an elongation rate of approximately 1.9 kb/min, and, surprisingly, polymerases remain at transcription sites 2.5 min longer than nascent RNAs. With a total polymerase residency time estimated at 333 s, 114 are assigned to elongation, and 63 are assigned to 3'-end processing and/or transcript release. However, mRNAs were released seconds after polyadenylation onset, and analysis of polymerase density by chromatin immunoprecipitation suggests that they pause or lose processivity after passing the polyA site. The strengths and limitations of this kinetic approach to analyze mRNA biogenesis in living cells are discussed.


Figures

Figure 1.
Figure 1.
Characterization of HIV-1 transcription sites. (A) Schematics of the HIV-1 reporters. (B) HIV-1 transcription sites contain a focal accumulation of mRNAs. Exo1 cells were transfected with a Tat expression vector and fixed 24 h later. (top) HIV-1 mRNAs and integrated DNA were detected by in situ hybridization. (middle) RNAPII was detected by immunofluorescence. (bottom) SC35 does not accumulate at HIV-1 transcription sites. Each field is 22 × 22 μm; insets are magnifications of the transcription sites (2.5 × 2.5 μm). Proteins were visualized by immunofluorescence. Bar, 8.8 μm.
Figure 2.
Figure 2.
Analysis of HIV-1 mRNA biogenesis by FRAP of nascent RNAs. Exo1 (A–G) or Exo2 (E, H, and I) cells were transfected with vectors expressing Tat and MS2-GFP and analyzed by FRAP. (A and B) FRAP of MS2-GFP analyzed at a high frame rate (160 ms) and on a a short time scale (5 s) with a confocal microscope. (A, left) Image of a transfected Exo1 cell (25 × 20 μm). (right) Recovery curves of MS2-GFP in the nucleoplasm of U2OS cells (pink curve) or at the HIV-1 transcription sites (blue curve). (B) Snapshot of the FRAP experiment (5 × 2 μm). Left, prebleach; middle, after bleach; right, 5-s time point. The bleached area is indicated by a circle (1.5-μm diameter). (C–I) FRAP of MS2-GFP analyzed by tracking transcription sites in 3D for 6 min using a wide-field microscope. (C) Image sequence from a FRAP experiment; each field is 30 × 25 μm. The time after bleach is indicated together with the bleached area (2.5-μm diameter). (D) Recovery curves of MS2-GFP in the nucleoplasm of U2OS cells (pink curve) and at the HIV-1 transcription site (blue curve). (E) Comparison of clones Exo1 and Exo2. The postbleach values were set to zero. (F) Schematic of the mRNA biogenesis pathway used to model the FRAP curves. (G and H) Fits of Exo1 (G) and Exo2 (H) FRAP curves with single exponential (red curve) and a two-step model that comprises a linear increase followed by an exponential (pink and green, respectively). (I) Comparison of experimental (red and blue) and computer-simulated (green) FRAP curves. Error bars represent SD. Bar, 7.2 μm.
Figure 3.
Figure 3.
Effect of mutants of RNAPII on the synthesis of nascent RNAs. Exo1 cells were transfected with vectors expressing mutant forms of RNAPII, Tat, and MS2-GFP and were treated with α-amanitin before FRAP. (top left) Recovery curves of the endogenous and transfected WTRES RNAPII (orange and blue curves, respectively). (top right) Comparison between the WTRES (blue), hC4 (red), and ΔCTD (green) RNAPII. (bottom) Fit of the two-step model (straight line followed an exponential) with WTRES (left) and hC4 curves (right). Error bars represent SD.
Figure 4.
Figure 4.
Elongation is a limiting step in the recovery of nascent RNAs. (A) Recoveries of MS2-GFP in Exo1 cells treated with camptothecin. Cells were transfected with vectors expressing Tat and MS2-GFP, treated or untreated with camptothecin, and analyzed by FRAP. (left) Comparison of treated (green) with untreated (blue) cells. (right) Treated cells were fitted with the two-step model. Pink, straight line; green, exponential component. (B) Comparison of the MS2-GFP recovery curves for the short and long HIV-1 reporters. ExoLong cells were transfected with vectors expressing Tat and MS2-GFP and were analyzed by FRAP. (top left) Comparison of the recovery curves of Exo1 cells (blue), Exo2 (red), and ExoLong (green). (top right) Fit of the long reporter with the two-step model. (bottom left) Comparison of Exo1 and ExoLong recovery curves after normalization by the initial slope (initiation rate). (bottom right) Comparison of experimental (blue) and computer-simulated (green) FRAP curves for the long reporter. (C) Recoveries of MS2-GFP in HIV-1 reporters lacking U3. pTRIP_1_13 cells expressing the ΔU3 reporter (pTRIP) were transfected as described in A and analyzed by FRAP. Error bars represent SD.
Figure 5.
Figure 5.
Measurements of nascent RNA species by quantitative in situ hybridization. (A) Schematic of the short reporter with the position of the probes indicated. The relative amount of probe corresponds to the Cy3/Cy5 (MS2) ratio measured at the transcription site of Exo1 cells. The predicted ratios were estimated from an elongation rate of 2.03 kb/min and 63.5 s for 3′-end formation (see Materials and methods). (B) Polyadenylated HIV-1 mRNAs do not accumulate at the transcription site of Exo1 cells. (top) Cells were hybridized with a mixture of pA+-Cy3 and MS2-Cy5 probes. (bottom) Cells expressing PABN1-GFP were hybridized with an MS2-Cy3 probe. Insets are magnifications of the transcription sites (2.5 × 2.5 μm). (C) Images of single cells with the various HIV-1 probes. Exo1 cells were transfected with Tat and hybridized with a mixture of Cy3-/MS2-Cy5 probes. (B and C) Field size is 20 × 20 μm. Bar, 6.7 μm.
Figure 6.
Figure 6.
Dynamic of RNAPII at HIV-1 transcription sites. Exo1 cells were transfected with vectors expressing GFP-PolII-C and MS2-Cherry and were analyzed on a confocal (A) or wide-field microscope (B). (A) FRAP of RNAPII analyzed at a high frame rate (160 ms) and on a short time scale (5 s). (left) Image of a transfected cell (25 × 25 μm). (right) Snapshots from a FRAP experiment (8 × 2 μm). The circle indicates the area of bleach. (B) FRAP recovery of GFP-PolII-C analyzed by tracking transcription sites in 3D for 15 min with a wide-field microscope. (top) Image sequence from a FRAP experiment; each field is 25 × 25 μm. (left graph) Recovery curves in the nucleoplasm of transfected U2OS cells (pink) or at the HIV-1 transcription site (blue). Data were normalized to prebleach values. (right graph) Comparison of the recoveries of nascent RNAs (pink) and the polymerase (blue). Data were normalized between pre- and postbleach values. Bar, 9.2 μm.
Figure 7.
Figure 7.
Density of RNAPII along the HIV-1 reporter. (A) RNAPII chromatin immunoprecipitation analysis of the HIV-1 reporter. Exo1 cells were incubated with GST-Tat or a mock control and subjected to chromatin immunoprecipitation with anti-RNAPII and the indicated primer sets (A, B, and C). Primer set C is located 220–420 nucleotides after the polyA site. B13 corresponds to a control region in the genome. (middle) PCR reactions on the input and immunoprecipitated chromatin. The size of the DNA fragments is indicated above the panels. (bottom) Quantification of the PCR reaction (mean of two experiments). (B) Schematic of the HIV-1 transcription cycle. The promoter, transcribed, and polyA regions of the HIV-1 reporter are schematized. The proposed residency times of the polymerases (gray disks) in various areas of the gene are indicated.

Similar articles

Cited by

References

    1. Ansari, A., and M. Hampsey. 2005. A role for the CPF 3′-end processing machinery in RNAP II-dependent gene looping. Genes Dev. 19:2969–2978. - PMC - PubMed
    1. Ashe, M., P. Griffin, W. James, and N. Proudfoot. 1995. Poly(A) site selection in the HIV-1 provirus: inhibition of promoter-proximal polyadenylation by the downstream major splice donor site. Genes Dev. 9:3008–3025. - PubMed
    1. Ashe, M.P., L.H. Pearson, and N.J. Proudfoot. 1997. The HIV-1 5′ LTR poly(A) site is inactivated by U1 snRNP interaction with the downstream major splice donor site. EMBO J. 16:5752–5763. - PMC - PubMed
    1. Batsche, E., M. Yaniv, and C. Muchardt. 2006. The human SWI/SNF subunit Brm is a regulator of alternative splicing. Nat. Struct. Mol. Biol. 13:22–29. - PubMed
    1. Braga, J., J.G. McNally, and M. Carmo-Fonseca. 2007. A reaction-diffusion model to study RNA motion by quantitative fluorescence recovery after photobleaching. Biophys. J. 92:2694–2703. - PMC - PubMed

Publication types

MeSH terms