T cell activation enhancement by endogenous pMHC acts for both weak and strong agonists but varies with differentiation state
- PMID: 17954567
- PMCID: PMC2118480
- DOI: 10.1084/jem.20062610
T cell activation enhancement by endogenous pMHC acts for both weak and strong agonists but varies with differentiation state
Abstract
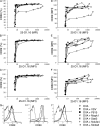
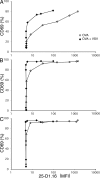
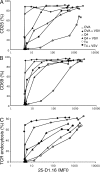
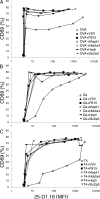
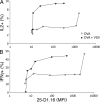
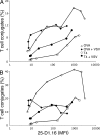
T cells are extremely sensitive in their ability to find minute amounts of antigenic peptide in the midst of many endogenous peptides presented on an antigen-presenting cell. The role of endogenous peptides in the recognition of foreign peptide and hence in T cell activation has remained controversial for CD8(+) T cell activation. We showed previously that in a CD8(+) T cell hybridoma, nonstimulatory endogenous peptides enhance T cell sensitivity to antigen by increasing the coreceptor function of CD8. However, others were not able to detect such enhancement in naive and activated CD8(+) T cells. Here, we show that endogenous peptides substantially enhance the ability of T cells to detect antigen, an effect measurable by up-regulation of activation or maturation markers and by increased effector function. This enhancement is most pronounced in thymocytes, moderate in naive T cells, and mild in effector T cells. The importance of endogenous peptides is inversely proportional to the agonist activity of the stimulatory peptide presented. Unlike for CD4(+) T cells, the T cell receptor of CD8(+) T cells does not distinguish between endogenous peptides for their ability to enhance antigen recognition.
Figures


Similar articles
-
CD8 binding to MHC class I molecules is influenced by T cell maturation and glycosylation.Immunity. 2001 Dec;15(6):1051-61. doi: 10.1016/s1074-7613(01)00252-7. Immunity. 2001. PMID: 11754824
-
Stage-dependent reactivity of thymocytes to self-peptide--MHC complexes.Proc Natl Acad Sci U S A. 2007 Mar 20;104(12):5038-43. doi: 10.1073/pnas.0700674104. Epub 2007 Mar 14. Proc Natl Acad Sci U S A. 2007. PMID: 17360333 Free PMC article.
-
High- and low-affinity single-peptide/MHC ligands have distinct effects on the development of mucosal CD8alphaalpha and CD8alphabeta T lymphocytes.Proc Natl Acad Sci U S A. 1999 May 11;96(10):5628-33. doi: 10.1073/pnas.96.10.5628. Proc Natl Acad Sci U S A. 1999. PMID: 10318935 Free PMC article.
-
Do T cells need endogenous peptides for activation?Nat Rev Immunol. 2008 Nov;8(11):895-900. doi: 10.1038/nri2431. Nat Rev Immunol. 2008. PMID: 18846098 Review.
-
Probing the activation requirements for naive CD8+ T cells with Drosophila cell transfectants as antigen presenting cells.Immunol Rev. 1998 Oct;165:249-65. doi: 10.1111/j.1600-065x.1998.tb01243.x. Immunol Rev. 1998. PMID: 9850865 Review.
Cited by
-
Phenotypic model for early T-cell activation displaying sensitivity, specificity, and antagonism.Proc Natl Acad Sci U S A. 2013 Mar 5;110(10):E888-97. doi: 10.1073/pnas.1300752110. Epub 2013 Feb 19. Proc Natl Acad Sci U S A. 2013. PMID: 23431198 Free PMC article.
-
Perspectives for computer modeling in the study of T cell activation.Cold Spring Harb Perspect Biol. 2010 Jun;2(6):a005538. doi: 10.1101/cshperspect.a005538. Epub 2010 May 5. Cold Spring Harb Perspect Biol. 2010. PMID: 20516137 Free PMC article. Review.
-
Phenotypic models of T cell activation.Nat Rev Immunol. 2014 Sep;14(9):619-29. doi: 10.1038/nri3728. Nat Rev Immunol. 2014. PMID: 25145757 Review.
-
What counts in the immunological synapse?Mol Cell. 2014 Apr 24;54(2):255-62. doi: 10.1016/j.molcel.2014.04.001. Mol Cell. 2014. PMID: 24766889 Free PMC article. Review.
-
Co-receptors and recognition of self at the immunological synapse.Curr Top Microbiol Immunol. 2010;340:171-89. doi: 10.1007/978-3-642-03858-7_9. Curr Top Microbiol Immunol. 2010. PMID: 19960314 Free PMC article. Review.
References
-
- Goldrath, A.W., and M.J. Bevan. 1999. Selecting and maintaining a diverse T-cell repertoire. Nature. 402:255–262. - PubMed
-
- Starr, T.K., S.C. Jameson, and K.A. Hogquist. 2003. Positive and negative selection of T cells. Annu. Rev. Immunol. 21:139–176. - PubMed
-
- Werlen, G., B. Hausmann, D. Naeher, and E. Palmer. 2003. Signaling life and death in the thymus: timing is everything. Science. 299:1859–1863. - PubMed
-
- Tanchot, C., F.A. Lemonnier, B. Perarnau, A.A. Freitas, and B. Rocha. 1997. Differential requirements for survival and proliferation of CD8 naive or memory T cells. Science. 276:2057–2062. - PubMed
-
- Ernst, B., D.S. Lee, J.M. Chang, J. Sprent, and C.D. Surh. 1999. The peptide ligands mediating positive selection in the thymus control T cell survival and homeostatic proliferation in the periphery. Immunity. 11:173–181. - PubMed
Publication types
MeSH terms
Substances
Grants and funding
LinkOut - more resources
Full Text Sources
Other Literature Sources
Research Materials

