. 2007 Dec 1;585(Pt 2):429-45.
doi: 10.1113/jphysiol.2007.142984. Epub 2007 Oct 11.

The development of synaptic plasticity induction rules and the requirement for postsynaptic spikes in rat hippocampal CA1 pyramidal neurones

Affiliations

The development of synaptic plasticity induction rules and the requirement for postsynaptic spikes in rat hippocampal CA1 pyramidal neurones

Katherine A Buchanan et al. J Physiol. .

Abstract

Coincident pre- and postsynaptic activity induces synaptic plasticity at the Schaffer collateral synapse onto CA1 pyramidal neurones. The precise timing, frequency and number of coincident action potentials required to induce synaptic plasticity is currently unknown. In this study we show that the postsynaptic activity required for the induction of long-term potentiation (LTP) changes with development. In acute slices from adult rats, coincident pre- and postsynaptic theta burst stimulation (TBS) induced LTP and we show that multiple high-frequency postsynaptic spikes are required. In contrast, in acute slices from juvenile (P14) rats, TBS failed to induce LTP unless the excitatory postsynaptic potentials (EPSPs) were of sufficient magnitude to initiate action potentials. We also show that coincident individual pre- and postsynaptic action potentials are only capable of inducing LTP in the juvenile when given at a frequency greater than 5 Hz and that the timing of individual pre- and postsynaptic action potentials relative to one another is not important. Finally, we show that local tetrodotoxin (TTX) application to the soma blocked LTP in adults, but not juveniles. These data demonstrate that somatic spiking is more important for LTP induction in the adult as opposed to juvenile rats and we hypothesize that the basis for this is the ability of action potentials in the postsynaptic CA1 pyramidal neurone to back-propagate into the dendrites. Therefore, the pre- and postsynaptic activity patterns required to induce LTP mature as the hippocampus develops.


Figures
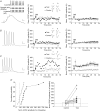
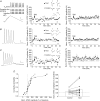
Figure 1
Figure 1. Coincident pre- and postsynaptic TBS induces LTP in adult hippocampal slices
A, subthreshold EPSPs induce no synaptic plasticity. Left trace, schematic of TBS protocol and example current clamp recording of single burst of 5 subthreshold EPSPs (scale bar, 2 mV, 10 ms). Middle graph, single example of TBS of subthreshold EPSPs experiment. Arrow indicates application of TBS stimulus to the test pathway. Control pathway receives no stimulation during TBS. Sample traces show average evoked responses during baseline (1–3 min) and after 30–35 min (scale bar, 20 pA, 20 ms). Right graph shows pooled data from 4 experiments showing no pathway-specific synaptic plasticity after TBS. B, postsynaptic action potentials induce no synaptic plasticity. Left trace, example current clamp recording of a single burst of 5 action potentials (scale bar, 20 mV, 10 ms). Middle graph, single example of postsynaptic action potentials TBS experiment (traces scale bar, 20 pA, 20 ms). Right graph, pooled data from 7 experiments showing no pathway-specific synaptic plasticity. Symbols and traces as above. C, pairing subthreshold EPSPs with postsynaptic action potentials induces LTP. Left trace, example current clamp recording of a single burst of paired subthreshold EPSPs and postsynaptic action potentials (black trace). Grey trace showing test burst of subthreshold EPSPs given before TBS (scale bar, 20 mV, 10 ms). Middle graph, single example of subthreshold EPSPs and action potentials TBS experiment (traces scale bar, 40 pA, 20 ms). Right graph, pooled data from 11 experiments showing pathway-specific LTP. Symbols and traces as above. D, distribution of synaptic plasticity induced in individual TBS experiments where subthreshold EPSPs are paired with postsynaptic action potentials. Left graph, cumulative probability plot of individual experiments showing the mean normalized EPSC amplitude at 30–35 min in the test (•) and control (○) pathways. Right graph, histogram of mean normalized EPSC amplitude at 30–35 min in the control and test pathways (open bars) overlaid by line graphs of individual experiments showing the relationship between the mean normalized EPSC amplitude at 30–35 min in the control (○) and test pathway (•).
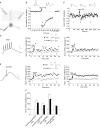
Figure 2
Figure 2. Coincident pre- and postsynaptic TBS fails to induce LTP in juvenile hippocampal slices
A, subthreshold EPSPs alone induce no pathway-specific synaptic plasticity. Left trace, schematic of TBS protocol and example current clamp recording of a single burst of 5 subthreshold EPSPs (scale bar, 4 mV, 20 ms). Middle graph, single example of subthreshold EPSPs TBS experiment. Arrow indicates TBS stimulus. Sample traces show average evoked responses during baseline (1–3 min) and at 30–35 min (scale bars 10 pA, 20 ms). Right graph shows pooled data from 5 experiments showing no pathway-specific synaptic plasticity after TBS. B, postsynaptic action potentials alone induce no synaptic plasticity. Left trace, example current clamp recording of a single burst of 5 action potentials (scale bar, 20 mV, 10 ms). Middle graph, single example of postsynaptic action potentials TBS experiment (traces scale bar, 20 pA, 20 ms). Right graph pooled data from 4 experiments showing no significant change in EPSC amplitude. Symbols and traces as above. C, pairing subthreshold EPSPs with postsynaptic action potentials fails to induce pathway-specific synaptic plasticity. Left trace, example current clamp recording of a single burst of paired subthreshold EPSPs and postsynaptic action potentials (black trace). Grey trace shows test burst of subthreshold EPSPs given before TBS (scale bar, 20 mV, 10 ms). Middle graph, single example of subthreshold EPSPs and action potentials TBS experiment (traces scale bar, 20 pA, 20 ms). Right graph, pooled data from 14 experiments showing no significant pathway-specific synaptic plasticity. Symbols and traces as above. D, distribution of synaptic plasticity induced in individual TBS experiments where subthreshold EPSPs are paired with postsynaptic action potentials. Left graph, cumulative probability plot of individual experiments showing the mean normalized EPSC amplitude at 30–35 min in the test (•) and control (○) pathways. Right graph, histogram of mean normalized EPSC amplitude at 30–35 min in the control and test pathways (open bars) overlaid by line graphs of individual experiments showing the relationship between the mean normalized EPSC amplitude at 30–35 min in the control (○) and test pathway (•).
Figure 3
Figure 3. TBS of suprathreshold EPSPs induces LTP in adult hippocampal slices dependent on the number of spikes initiated
A, TBS of suprathreshold EPSPs induces LTP. Left, example trace of suprathreshold EPSP burst (scale bar 20 mV, 20 ms). Middle graph, single example of suprathreshold TBS experiment. Arrow indicates TBS, traces show average baseline response (1–3 min) and average response at 30–35 min (scale bar 20 pA, 20 mV). Right graph, pooled data from 25 experiments showing pathway-specific LTP. B, summary bar chart. Values show mean normalized EPSC amplitude at 30–35 min in the test (filled bars) and control (open bars) pathways. * denotes P < 0.05. C, magnitude of LTP in the test pathway depends on which EPSP triggers the first spike. Experiments were pooled depending on which EPSP in the burst triggered the first spike. •, individual experiments; ○, average values. D, magnitude of LTP in the test pathway depends on total amount of firing. Individual experiments show a correlation between higher firing percentage and increased levels of LTP. E, magnitude of LTP in the test pathway depends on the amplitude of summated EPSPs. Individual experiments show a correlation between summated EPSP amplitude and increased levels of LTP.
Figure 4
Figure 4. Postsynaptic action potential bursts are required for LTP Induction in adult hippocampal slices
A, TBS consisting of a single postsynaptic action potential paired with 5 subthreshold EPSPs induces no pathway-specific synaptic plasticity. Left, schematic of TBS protocol and example trace of single burst of 5 subthreshold EPSPs and single postsynaptic action potential (scale bar 40 mV, 10 ms). Middle graph, example of single experiment, arrow indicates application of TBS. Sample traces show average evoked responses during baseline (1–5 min) and at 30–35 min (scale bars 20 pA, 20 ms). Right graph, pooled data from 8 experiments showing a small increase in both the test and control pathways. B, TBS consisting of a burst of 2 postsynaptic action potentials paired with 5 subthreshold EPSPs induces pathway-specific LTP. Left, example trace of single burst of 5 subthreshold EPSPs and 2 postsynaptic action potential (scale bar 40 mV, 10 ms). Middle graph, example of a single experiment (traces scale bar, 100 pA, 20 ms). Right graph, pooled data from 11 experiments showing a pathway-specific LTP at 30–35 min. Symbols and traces as above. C, summary bar chart. Values show mean normalized EPSC amplitude at 30–35 min in the test (filled bars) and control (open bars) pathways. * denotes P < 0.05.
Figure 5
Figure 5. Paired EPSPs and postsynaptic spikes do not induce synaptic plasticity in adult hippocampal slices
A, positive spike timing intervals do not result in LTP. Left trace, example trace of single spike timing pair consisting of an EPSP and postsynaptic action potential with a positive spike timing interval of +4 ms (scale bar, 20 mV, 20 ms). Right graph, pooled data from 7 positive interval spike timing experiments at 10 Hz (STI of between +0.4 ms and +15.6 ms). Bar indicates application of spike timing stimulation (ST). No LTP was observed in the test pathway compared with the control pathway. B, negative spike timing intervals do not result in LTP. Left trace, example trace of single spike timing pair consisting of an EPSP and postsynaptic action potential with a negative spike timing interval of −8.6 ms (scale bar, 10 mV, 10 ms). Right graph, pooled data from 10 negative interval spike timing experiments at 10 Hz (STIs of between −1.8 ms and −14.1 ms). No pathway-specific LTP was observed but there was a consistent transient depression in the test pathway of unknown origin. C, summary graph of all spike timing experiments at 10 Hz. Data points show mean normalized EPSC amplitude of the test pathway at 30–35 min against spike timing interval (STI).
Figure 6
Figure 6. TBS of suprathreshold EPSPs is capable of inducing LTP in juvenile hippocampal slices
A, TBS of suprathreshold EPSPs induces LTP. Left, example trace of suprathreshold EPSP burst (scale bar 20 mV, 20 ms). Middle graph, single example of suprathreshold TBS experiment. Arrow indicates application of TBS, traces show average baseline response (1–3 min) and average response at 30–35 min (scale bars, 100 pA, 20 ms). Right graph, pooled data from 20 experiments showing pathway-specific LTP. B, summary bar chart. Values show mean normalized EPSC amplitude at 30–35 min for the test (filled bars) and control (open bars) pathway. * denotes P < 0.05. C, correlation between timing of the first spike within a burst and plasticity in the test pathway. Individual experiments were pooled depending on which EPSP in a burst triggered the first spike (•). Average values for each pool are also shown (○). D, individual experiments show no correlation between the percentage of EPSPs causing a spike and plasticity in the test pathway. E, individual experiments show no correlation between the amplitude of summated EPSPs and plasticity in the test pathway.
Figure 7
Figure 7. Induction of synaptic plasticity in juvenile hippocampal slices does not depend on the spike timing interval
A, positive spike timing intervals result in LTP. Left trace, example trace of single spike timing pair consisting of an EPSP and postsynaptic action potential with a positive spike timing interval of +2.4 ms (scale bar, 10 mV, 10 ms). Right graph, pooled data from 50 positive interval spike timing experiments at 10 Hz (STI of between +0.2 ms and +25.0 ms). Bar indicates application of spike timing stimulation. LTP was observed in the test pathway but not in the control pathway. B, negative spike timing intervals result in LTP. Left trace, example trace of single spike timing pair consisting of an EPSP and postsynaptic action potential with a negative spike timing interval of −10.8 ms (scale bar, 10 mV, 10 ms). Right graph, pooled data from 45 negative interval spike timing experiments at 10 Hz (STIs of between −0.4 ms and −35.2 ms). Pathway-specific LTP was again observed. C, summary graph of all spike timing experiments at 10 Hz. Data points show mean normalized EPSC amplitude in the test pathway at 30–35 min against spike timing interval. D, correlation of baseline EPSC amplitude and plasticity. Data points show mean baseline EPSC amplitude in the test pathway (1–4 min) for positive (• and continuous line) and negative (○ and dashed line) spike timing intervals against the amount of LTP.
Figure 8
Figure 8. Induction of synaptic plasticity in juvenile hippocampal slices depends on the frequency of stimulation
A, left trace, example of single spike timing pair of EPSP and postsynaptic action potential with a positive spike timing interval of +3.2 ms (scale bar, 10 mV, 10 ms). Middle graph, example of single spike timing experiment at 10 Hz. Bar indicates application of spike timing stimulation, traces show average baseline response (1–4 min) and average response at 30–35 min (scale bar, 40 pA, 20 ms). Right graph, pooled data from 95 experiments of spike timing stimulation (interval −35 ms to +25 ms) at 10 Hz showing pathway-specific LTP. B, pooled data from 4 experiments of spike timing stimulation at 1 Hz showing no plasticity. C, pooled data from 8 experiments of spike timing stimulation at 5 Hz showing no plasticity. D, pooled data from 11 experiments of spike timing stimulation at 20 Hz showing pathway-specific LTP. E, frequency dependency of spike timing plasticity. Values show mean normalized EPSC amplitude in the test pathway at 30–35 min after ST stimulation at various frequencies. F, LTP is correlated with the level of chronic depolarization during STDP induction. Left, example traces showing 10 paired stimulations during the STDP induction at 10 Hz (top) and 20 Hz (bottom). Scale bar 4 mV, 200 ms (top) or 100 ms (bottom). Right, the amount of LTP in the test pathway is correlated with the level of depolarization during STDP induction. ○, data from 10 Hz induction; •, 20 Hz induction. The line is a simple linear regression to all the data points.
Figure 9
Figure 9. Somatic spikes within a theta burst attenuate more in juvenile than adult hippocampal slices
A, example traces of theta burst spiking in adult (top) and juvenile (bottom) slices. Bursts were induced by 2 ms current injections repeated 5 times (scale bar 20 mV, 10 ms). B, mean normalized spike amplitude in juvenile (•) and adult (○) slices demonstrates a greater degree of attenuation in the juvenile slices. Each spike amplitude was measured as the difference between the membrane potential 1 ms before the 2 ms current injection and the peak potential.
Figure 10
Figure 10. Somatic spikes are required for paired TBS-induced LTP in adult slices but not suprathreshold TBS-induced LTP in juvenile slices
A, schematic diagram of the experimental set-up. TTX was applied locally to the soma of the CA1 pyramidal cell and the flow of solution in the bath was from top to bottom. Two stimulating electrodes were placed in the Schaffer collateral pathway. B, local TTX application completely blocked the somatic spike but this recovered within minutes. Arrow represents time of single 800 ms puff of TTX (10 μm). Example traces above show responses to somatic current injection at the time points indicated on the graph (scale bar 20 mV, 10 ms). C, local TTX application caused a transient non-significant depression in the EPSP. Arrow represents time of single 800 ms puff of TTX (10 μm). Example traces above show EPSPs at the time points indicated on the graph (scale bar 2 mV, 40 ms). D, local TTX application blocks LTP induced by paired TBS in adult slices. Left trace, example recording of a single burst of postsynaptic current injections showing complete block of the somatic action potential (scale bar 10 mV, 10 ms). Middle graph, single example of subthreshold EPSPs and action potentials TBS experiment in adult slices with local TTX application. Arrow represents time of TBS and TTX application. Sample traces show average evoked responses during baseline (1–3 min) and after 30–35 min (scale bar 40 pA, 20 ms). Right graph, pooled data from 8 experiments showing no pathway-specific LTP. E, TBS of suprathreshold EPSPs alone induces LTP in juvenile slices despite local TTX application. Left, example trace of suprathreshold EPSP burst showing a putative dendritic spike but no somatic spike (scale bar 20 mV, 20 ms). Middle graph, single example of suprathreshold TBS experiment. Arrow indicates application of TBS and TTX, traces show average baseline response (1–3 min) and average response at 30–35 min (scale bars 100 pA, 20 ms). Right graph, pooled data from 7 experiments showing pathway-specific LTP. F, summary bar chart. Values show mean normalized EPSC amplitude at 30–35 min for the test (filled bars) and control (open bars) pathway. * denotes P < 0.05.

Similar articles

Cited by

References

    1. Barria A, Malinow R. Subunit-specific NMDA receptor trafficking to synapses. Neuron. 2002;35:345–353. - PubMed
    1. Bi GQ, Poo MM. Synaptic modifications in cultured hippocampal neurons: dependence on spike timing, synaptic strength, and postsynaptic cell type. J Neurosci. 1998;18:10464–10472. - PMC - PubMed
    1. Bliss TVP, Collingridge GL. A synaptic model of memory – long-term potentiation in the hippocampus. Nature. 1993;361:31–39. - PubMed
    1. Callaway JC, Ross WN. Frequency-dependent propagation of sodium action-potentials in dendrites of hippocampal CA1 pyramidal neurons. J Neurophysiol. 1995;74:1395–1403. - PubMed
    1. Chen SM, Yue CY, Yaari Y. A transitional period of Ca2+-dependent spike afterclepolarization and bursting in developing rat CA1 pyramidal cells. J Physiol. 2005;567:79–93. - PMC - PubMed

Publication types