

Chromosome territory reorganization in a human disease with altered DNA methylation
- PMID: 17923676
- PMCID: PMC2034264
- DOI: 10.1073/pnas.0702924104
Chromosome territory reorganization in a human disease with altered DNA methylation
Abstract
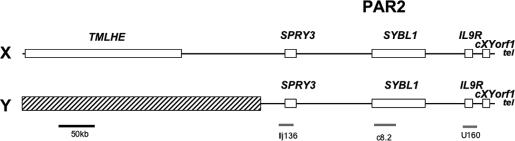
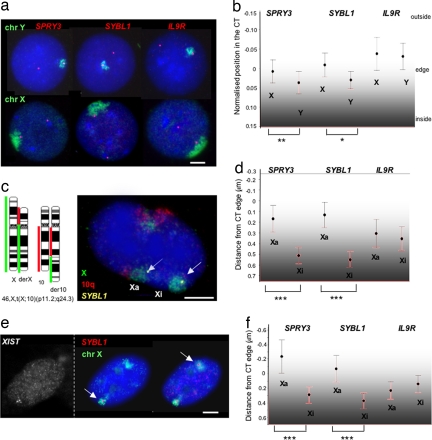
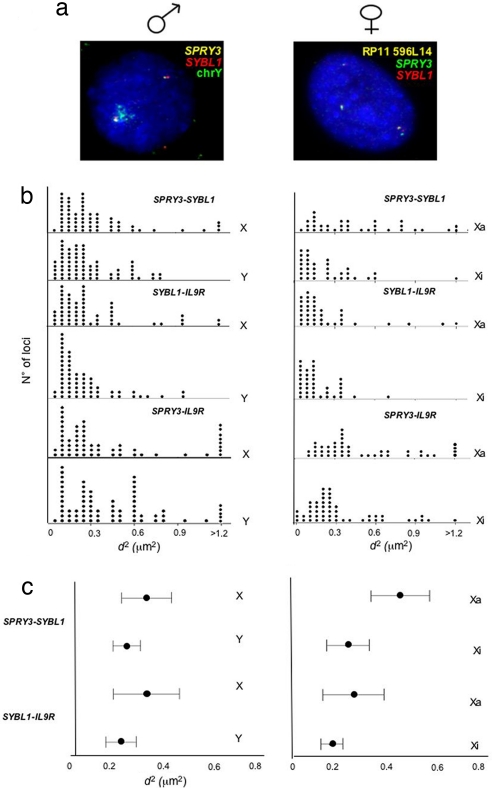
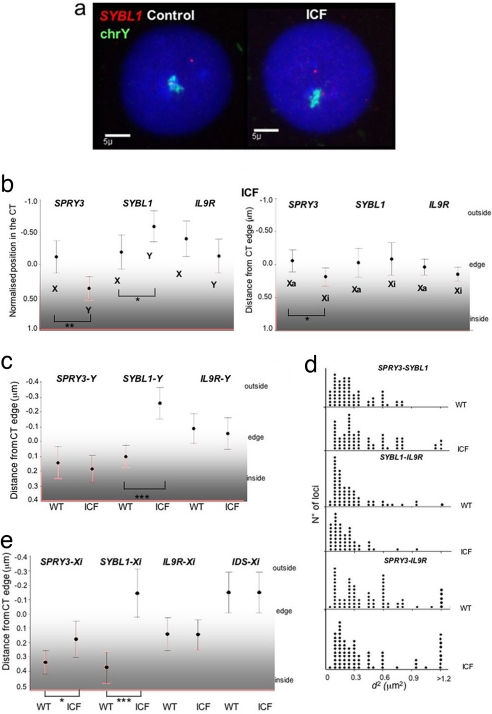
Chromosome territory (CT) organization and chromatin condensation have been linked to gene expression. Although individual genes can be transcribed from inside CTs, some regions that have constitutively high expression or are coordinately activated loop out from CTs and decondense. The relationship between epigenetic marks, such as DNA methylation, and higher-order chromatin structures is largely unexplored. DNMT3B mutations in immunodeficiency centromeric instability facial anomalies (ICF) syndrome result in loss of DNA methylation at particular sites, including CpG islands on the inactive X chromosome (Xi). This allows the specific effects of DNA methylation on CTs to be examined. Using fluorescence in situ hybridization, we reveal a differential organization of the human pseudoautosomal region (PAR)2 between the CTs of the X and Y in normal males and the active X (Xa) and the Xi in females. There is also a more condensed chromatin structure on Xi compared with Xa in this region. PAR2 genes are relocalized toward the outside of the Y and Xi CTs in ICF, and on the Xi, we show that this can extend to genes distant from the site of DNA hypomethylation itself. This reorganization is not simply a reflection of the transcriptional activation of the relocalized genes. This report of altered CT organization in a human genetic disease illustrates that DNA hypomethylation at restricted sites in the genome can lead to more extensive changes in nuclear organization away from the original site of epigenetic change.
Conflict of interest statement
The authors declare no conflict of interest.
Figures
Similar articles
-
Defective de novo methylation of viral and cellular DNA sequences in ICF syndrome cells.Hum Mol Genet. 2002 Sep 1;11(18):2091-102. doi: 10.1093/hmg/11.18.2091. Hum Mol Genet. 2002. PMID: 12189161
-
Allelic inactivation of the pseudoautosomal gene SYBL1 is controlled by epigenetic mechanisms common to the X and Y chromosomes.Hum Mol Genet. 2002 Dec 1;11(25):3191-8. doi: 10.1093/hmg/11.25.3191. Hum Mol Genet. 2002. PMID: 12444103
-
Maintenance of X- and Y-inactivation of the pseudoautosomal (PAR2) gene SPRY3 is independent from DNA methylation and associated to multiple layers of epigenetic modifications.Hum Mol Genet. 2006 Apr 1;15(7):1123-32. doi: 10.1093/hmg/ddl027. Epub 2006 Feb 24. Hum Mol Genet. 2006. PMID: 16500999
-
ICF syndrome cells as a model system for studying X chromosome inactivation.Cytogenet Genome Res. 2002;99(1-4):25-9. doi: 10.1159/000071571. Cytogenet Genome Res. 2002. PMID: 12900541 Review.
-
ICF, an immunodeficiency syndrome: DNA methyltransferase 3B involvement, chromosome anomalies, and gene dysregulation.Autoimmunity. 2008 May;41(4):253-71. doi: 10.1080/08916930802024202. Autoimmunity. 2008. PMID: 18432406 Free PMC article. Review.
Cited by
-
Increased expression of P-glycoprotein and doxorubicin chemoresistance of metastatic breast cancer is regulated by miR-298.Am J Pathol. 2012 Jun;180(6):2490-503. doi: 10.1016/j.ajpath.2012.02.024. Epub 2012 Apr 19. Am J Pathol. 2012. PMID: 22521303 Free PMC article.
-
Gene positioning.Cold Spring Harb Perspect Biol. 2010 Jun;2(6):a000588. doi: 10.1101/cshperspect.a000588. Epub 2010 May 19. Cold Spring Harb Perspect Biol. 2010. PMID: 20484389 Free PMC article. Review.
-
Losing DNA methylation at repetitive elements and breaking bad.Epigenetics Chromatin. 2021 Jun 3;14(1):25. doi: 10.1186/s13072-021-00400-z. Epigenetics Chromatin. 2021. PMID: 34082816 Free PMC article. Review.
-
Tunable DNMT1 degradation reveals DNMT1/DNMT3B synergy in DNA methylation and genome organization.J Cell Biol. 2024 Apr 1;223(4):e202307026. doi: 10.1083/jcb.202307026. Epub 2024 Feb 20. J Cell Biol. 2024. PMID: 38376465 Free PMC article.
-
Spatial organization of genes as a component of regulated expression.Chromosoma. 2010 Feb;119(1):13-25. doi: 10.1007/s00412-009-0236-2. Epub 2009 Aug 30. Chromosoma. 2010. PMID: 19727792 Free PMC article. Review.
References
-
- Heard E, Bickmore W. Curr Opin Cell Biol. 2007;19(3):311–316. - PubMed
Publication types
MeSH terms
Substances
Grants and funding
LinkOut - more resources
Full Text Sources
Research Materials
