

Defective lipid delivery modulates glucose tolerance and metabolic response to diet in apolipoprotein E-deficient mice
- PMID: 17914034
- PMCID: PMC2830804
- DOI: 10.2337/db07-0403
Defective lipid delivery modulates glucose tolerance and metabolic response to diet in apolipoprotein E-deficient mice
Abstract
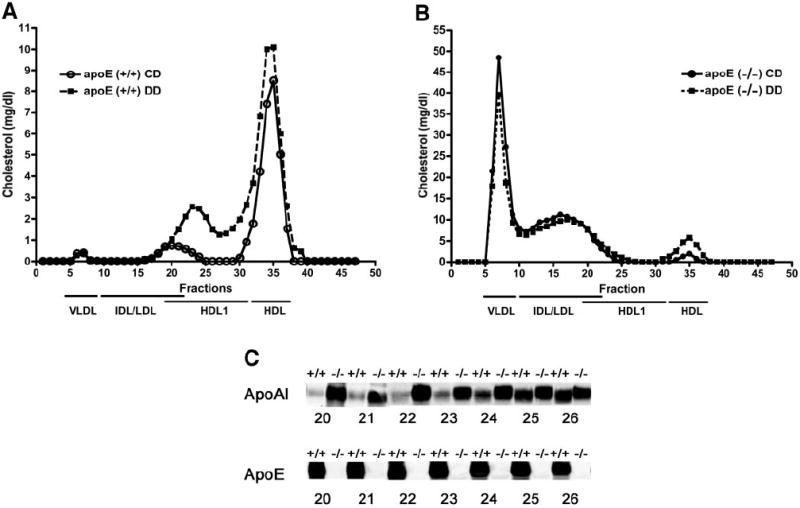
Objective: Apolipoprotein E (ApoE) regulates plasma lipid levels via modulation of lipolysis and serving as ligand for receptor-mediated clearance of triglyceride (TG)-rich lipoproteins. This study tested the impact of modulating lipid delivery to tissues on insulin responsiveness and diet-induced obesity.
Research design and methods: ApoE(+/+) and apoE(-/-) mice were placed on high-fat-high-sucrose diabetogenic diet or control diet for 24 weeks. Plasma TG clearance, glucose tolerance, and tissue uptake of dietary fat and glucose were assessed.
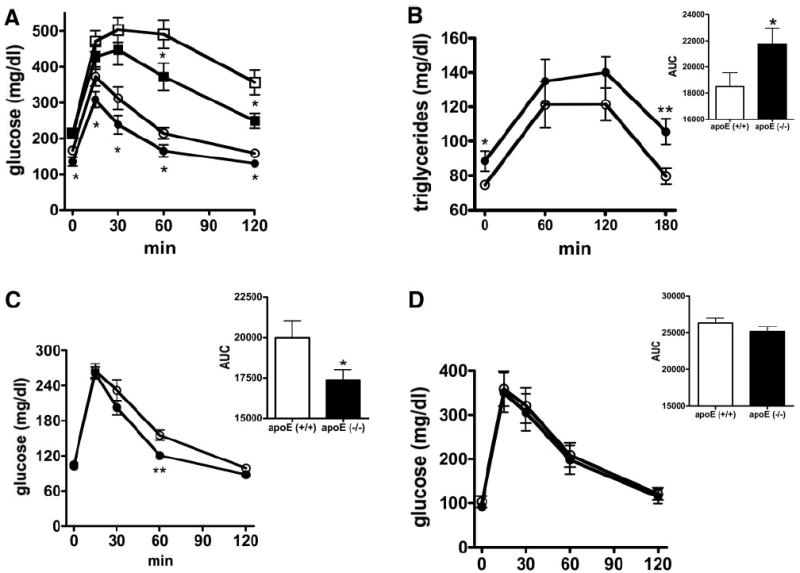
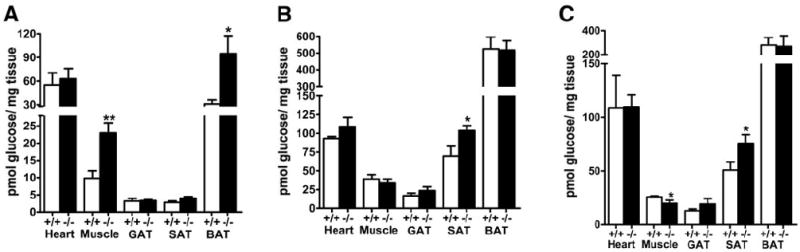
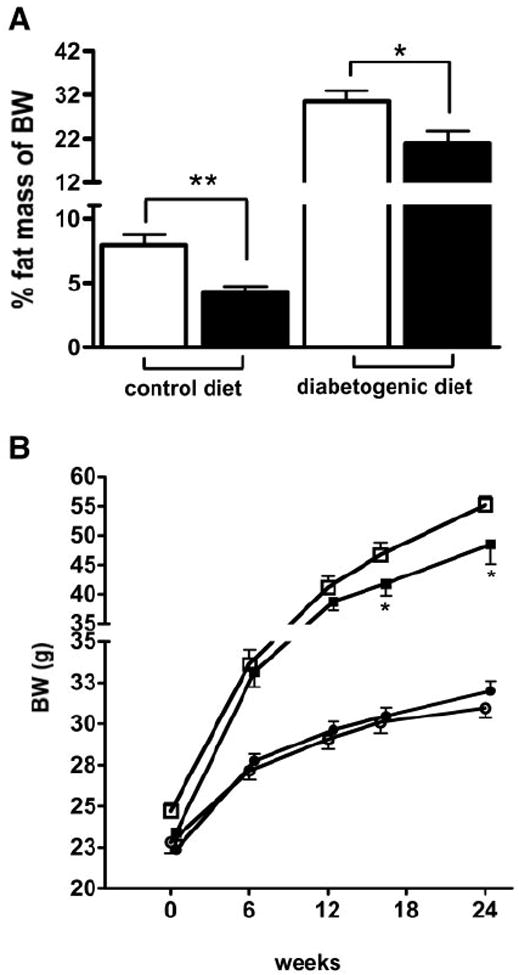
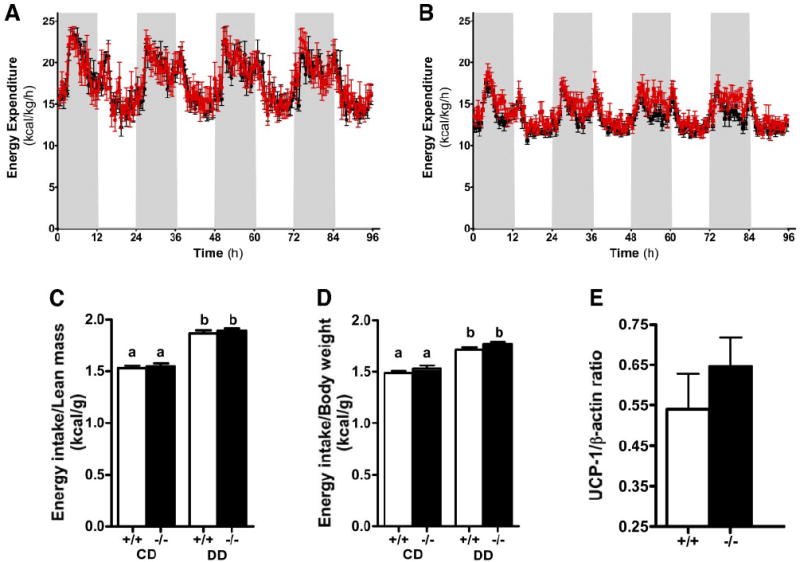
Results: Plasma TG clearance and lipid uptake by adipose tissue were impaired, whereas glucose tolerance was improved in control diet-fed apoE(-/-) mice compared with apoE(+/+) mice after an oral lipid load. Fat mass was reduced in apoE(-/-) mice compared with apoE(+/+) mice under both dietary conditions. The apoE(-/-) mice exhibited lower body weight and insulin levels than apoE(+/+) mice when fed the diabetogenic diet. Glucose tolerance and uptake by muscle and brown adipose tissue (BAT) was also improved in mice lacking apoE when fed the diabetogenic diet. Indirect calorimetry studies detected no difference in energy expenditure and respiratory quotient between apoE(+/+) and apoE(-/-) mice on control diet. Energy expenditure and uncoupling protein-1 expression in BAT were slightly but not significantly increased in apoE(-/-) mice on diabetogenic diet.
Conclusions: These results demonstrated that decreased lipid delivery to insulin-sensitive tissues improves insulin sensitivity and ameliorates diet-induced obesity.
Figures
Similar articles
-
Apolipoprotein E-dependent inverse regulation of vertebral bone and adipose tissue mass in C57Bl/6 mice: modulation by diet-induced obesity.Bone. 2010 Oct;47(4):736-45. doi: 10.1016/j.bone.2010.07.002. Epub 2010 Jul 12. Bone. 2010. PMID: 20633710
-
Apolipoprotein E deficiency abrogates insulin resistance in a mouse model of type 2 diabetes mellitus.Diabetologia. 2009 Jul;52(7):1434-41. doi: 10.1007/s00125-009-1378-8. Epub 2009 May 13. Diabetologia. 2009. PMID: 19436992 Free PMC article.
-
ApoE and the role of very low density lipoproteins in adipose tissue inflammation.Atherosclerosis. 2012 Aug;223(2):342-9. doi: 10.1016/j.atherosclerosis.2012.06.003. Epub 2012 Jun 19. Atherosclerosis. 2012. PMID: 22770993 Free PMC article.
-
A 1,3-diacylglycerol-rich oil induces less atherosclerosis and lowers plasma cholesterol in diabetic apoE-deficient mice.Atherosclerosis. 2007 Jul;193(1):55-61. doi: 10.1016/j.atherosclerosis.2006.08.024. Epub 2006 Sep 22. Atherosclerosis. 2007. PMID: 16996521
-
Scavenger Receptor Class B Type I Regulates Plasma Apolipoprotein E Levels and Dietary Lipid Deposition to the Liver.Biochemistry. 2015 Sep 15;54(36):5605-16. doi: 10.1021/acs.biochem.5b00700. Epub 2015 Sep 3. Biochemistry. 2015. PMID: 26313465
Cited by
-
Spirulina Liquid Extract Protects against Fibrosis Related to Non-Alcoholic Steatohepatitis and Increases Ursodeoxycholic Acid.Nutrients. 2019 Jan 18;11(1):194. doi: 10.3390/nu11010194. Nutrients. 2019. PMID: 30669332 Free PMC article.
-
Cholesterol-Lowering Gene Therapy Prevents Heart Failure with Preserved Ejection Fraction in Obese Type 2 Diabetic Mice.Int J Mol Sci. 2019 May 6;20(9):2222. doi: 10.3390/ijms20092222. Int J Mol Sci. 2019. PMID: 31064116 Free PMC article.
-
The anti-inflammatory effects of exercise training promote atherosclerotic plaque stabilization in apolipoprotein E knockout mice with diabetic atherosclerosis.Eur J Histochem. 2013 Mar 25;57(1):e3. doi: 10.4081/ejh.2013.e3. Eur J Histochem. 2013. PMID: 23549462 Free PMC article.
-
Simultaneous LC/MS/MS quantification of eight apolipoproteins in normal and hypercholesterolemic mouse plasma.J Lipid Res. 2019 Apr;60(4):900-908. doi: 10.1194/jlr.D084301. Epub 2019 Feb 5. J Lipid Res. 2019. PMID: 30723096 Free PMC article.
-
The low density lipoprotein receptor modulates the effects of hypogonadism on diet-induced obesity and related metabolic perturbations.J Lipid Res. 2014 Jul;55(7):1434-47. doi: 10.1194/jlr.M050047. Epub 2014 May 15. J Lipid Res. 2014. PMID: 24837748 Free PMC article.
References
-
- Kahn BB, Rossetti L. Type 2 diabetes: who is conducting the orchestra? Nat Genet. 1998;20:223–225. - PubMed
-
- Taylor SI. Deconstructing type 2 diabetes. Cell. 1999;97:9–12. - PubMed
-
- Unger RH. Minireview. Weapons of lean body mass destruction: the role of ectopic lipids in the metabolic syndrome. Endocrinology. 2003;144:5159–5165. - PubMed
-
- McGarry JD. Banting Lecture 2001: Dysregulation of fatty acid metabolism in the etiology of type 2 diabetes. Diabetes. 2002;51:7–18. - PubMed
-
- Cline GW, Petersen KF, Krssak M, Shen J, Hundal RS, Trajanoski Z, Inzucchi S, Dresner A, Rothman DL, Shulman GI. Impaired glucose transport as a cause of decreased insulin-stimulated muscle glycogen synthesis in type 2 diabetes. N Engl J Med. 1999;341:240–246. - PubMed
Publication types
MeSH terms
Substances
Grants and funding
LinkOut - more resources
Full Text Sources
Molecular Biology Databases
Research Materials
Miscellaneous
