. 2007 Oct;9(10):1142-51.
doi: 10.1038/ncb1634. Epub 2007 Sep 23.

Bif-1 interacts with Beclin 1 through UVRAG and regulates autophagy and tumorigenesis

Affiliations

Bif-1 interacts with Beclin 1 through UVRAG and regulates autophagy and tumorigenesis

Yoshinori Takahashi et al. Nat Cell Biol. 2007 Oct.

Abstract

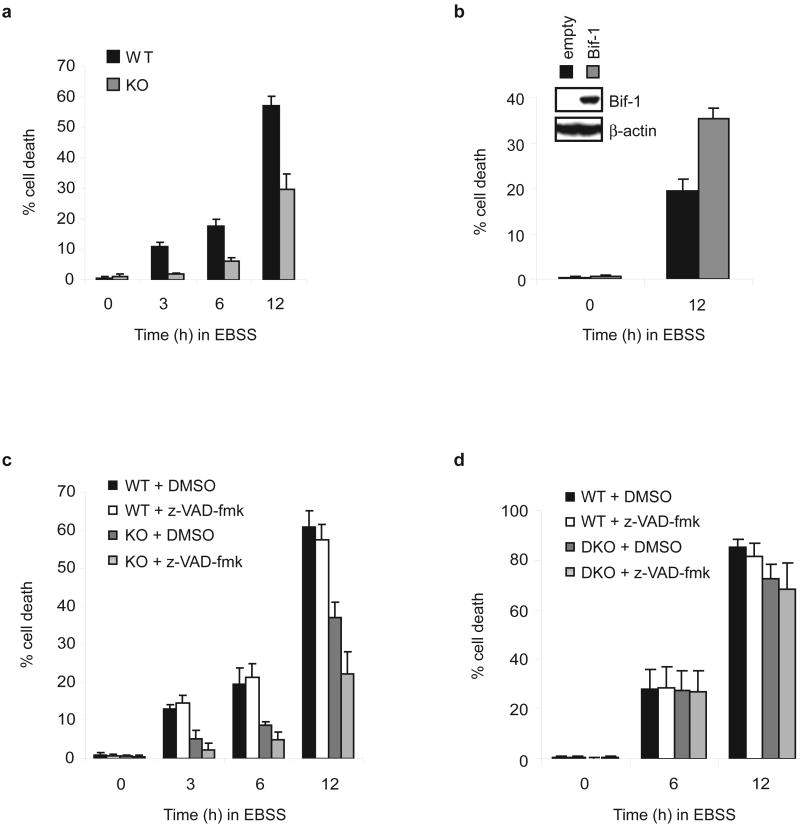
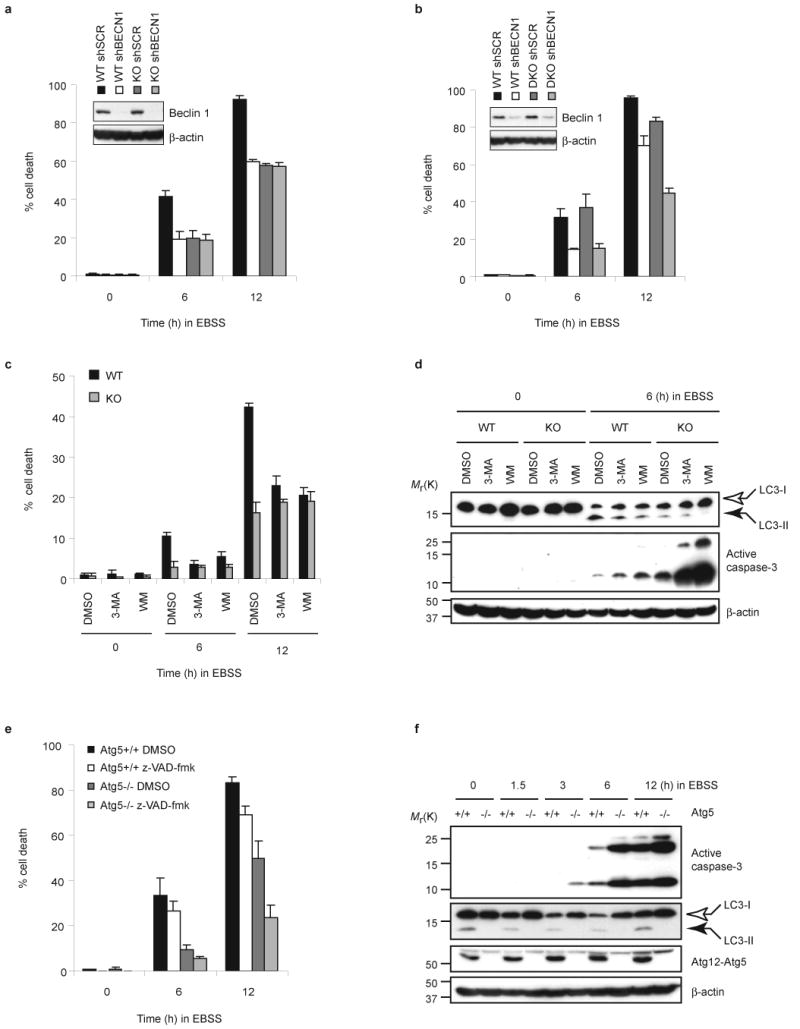
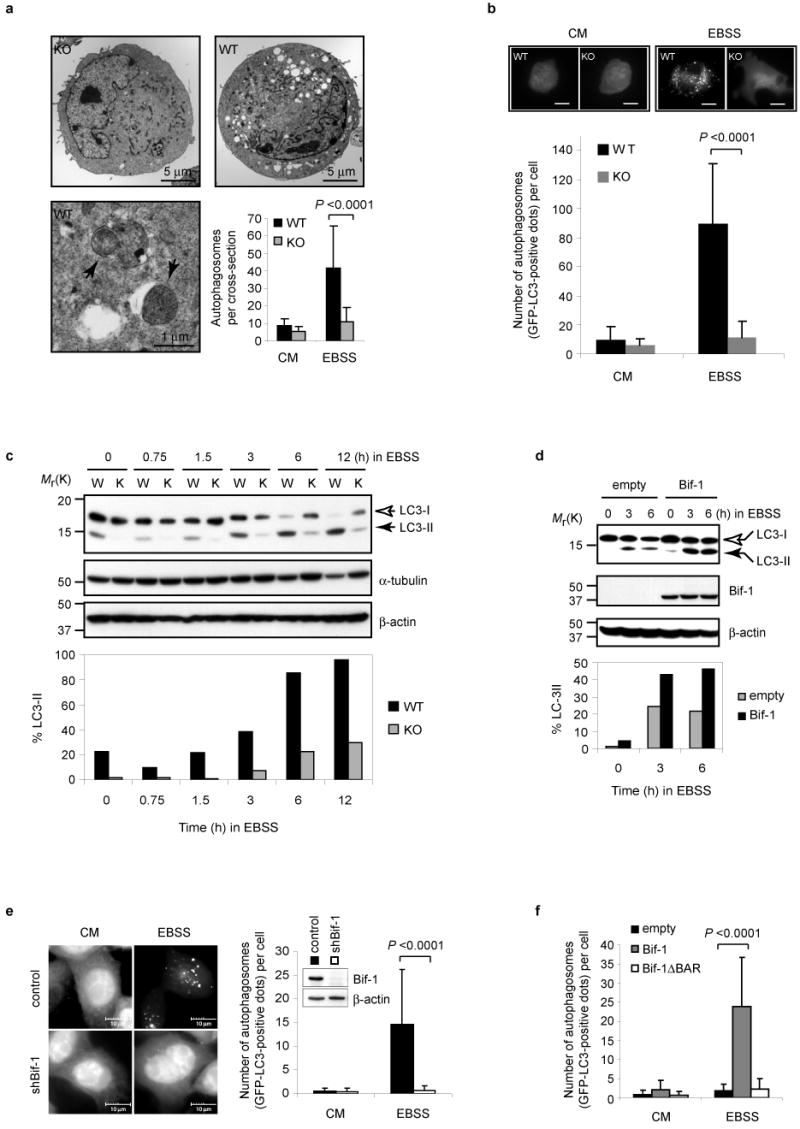
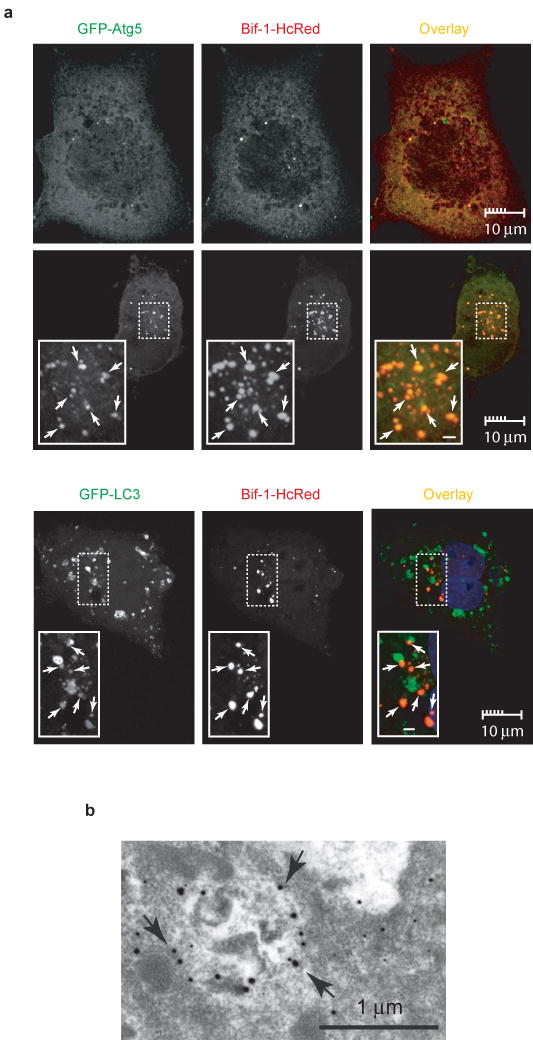
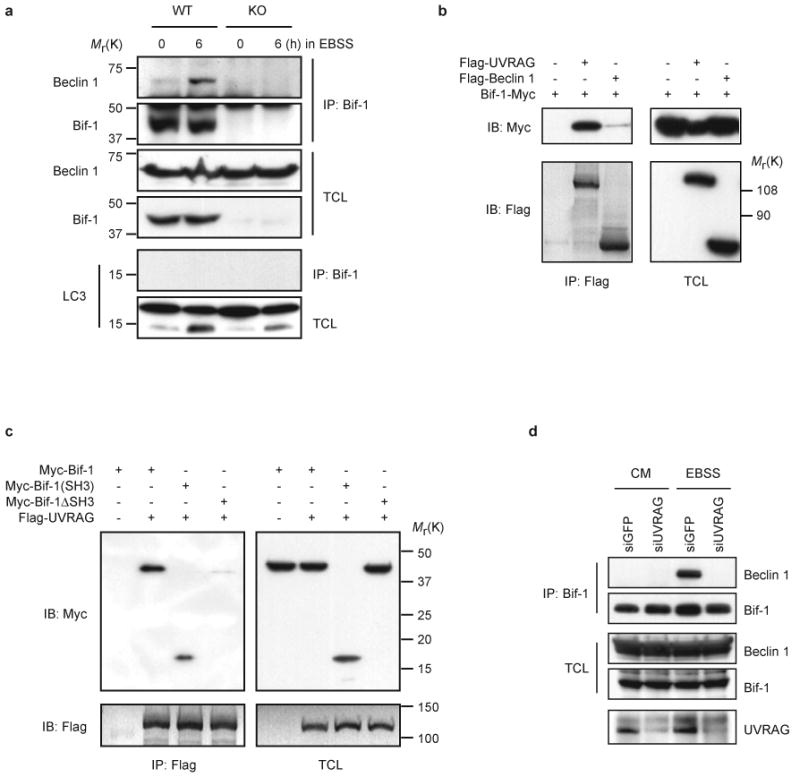
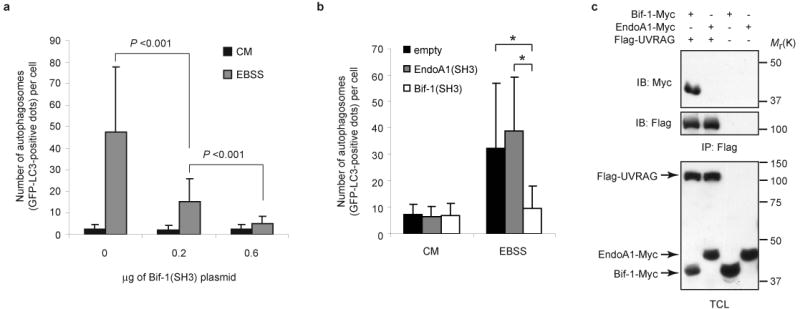
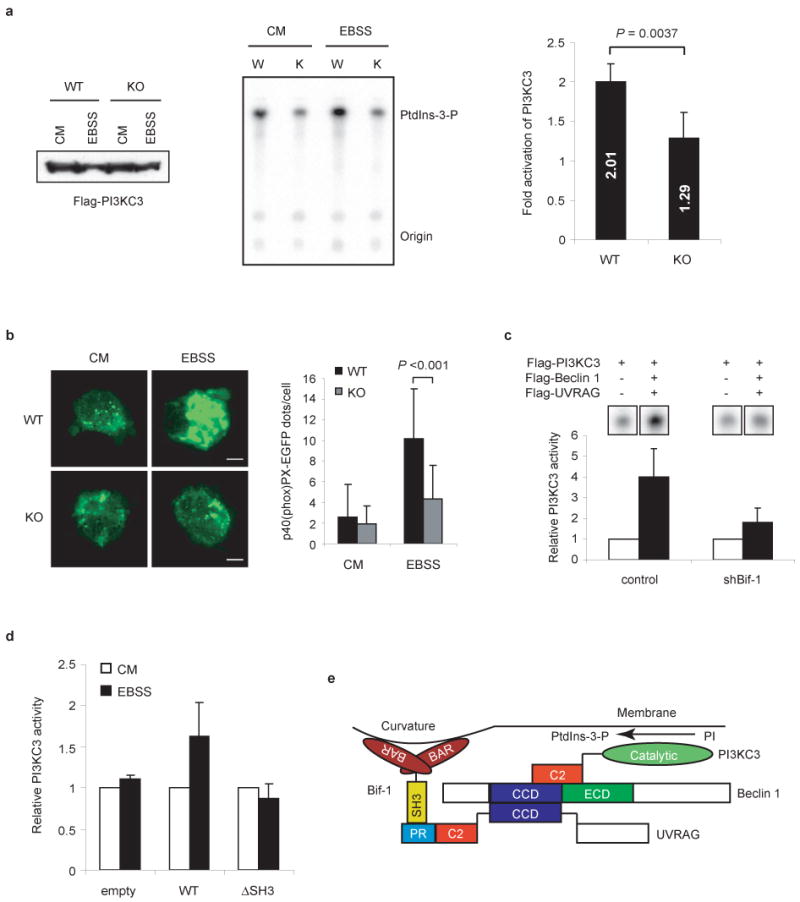
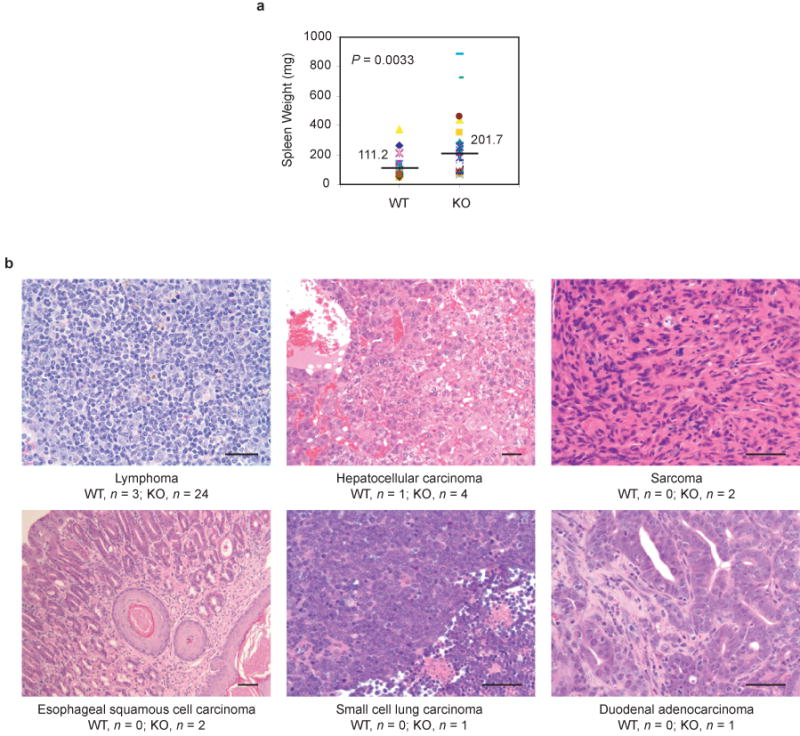
Autophagy is an evolutionarily conserved 'self-eating' process. Although the genes essential for autophagy (named Atg) have been identified in yeast, the molecular mechanism of how Atg proteins control autophagosome formation in mammalian cells remains to be elucidated. Here, we demonstrate that Bif-1 (also known as Endophilin B1) interacts with Beclin 1 through ultraviolet irradiation resistance-associated gene (UVRAG) and functions as a positive mediator of the class III PI(3) kinase (PI(3)KC3). In response to nutrient deprivation, Bif-1 localizes to autophagosomes where it colocalizes with Atg5, as well as microtubule-associated protein light chain 3 (LC3). Furthermore, loss of Bif-1 suppresses autophagosome formation. Although the SH3 domain of Bif-1 is sufficient for binding to UVRAG, both the BAR and SH3 domains are required for Bif-1 to activate PI(3)KC3 and induce autophagosome formation. We also observed that Bif-1 ablation prolongs cell survival under starvation conditions. Moreover, knockout of Bif-1 significantly enhances the development of spontaneous tumours in mice. These findings suggest that Bif-1 joins the UVRAG-Beclin 1 complex as a potential activator of autophagy and tumour suppressor.


Figures

Figure 1
Figure 1
Loss of Bif-1 suppresses caspase-independent cell death induced by nutrition deprivation. The percentage of dead cells was determined at the indicated timepoints by trypan blue exclusion assay (mean ± s.d.; n = 3). (a) Bif-1 +/+ (WT) and -/- (KO) MEFs were cultured in EBSS for 0, 3, 6 or 12 h. (b) Bif-1 KO MEFs stably transfected with a Bif-1 expression plasmid or control empty vector were incubated in EBSS for 0 or 12 h. Recovery of Bif-1 expression in Bif-1 KO cells was determined by immunoblot analysis (inset). (c) Bif-1 WT and KO MEFs were cultured in EBSS in the presence of 50 μM z-VAD-fmk or control DMSO for 0, 3, 6 or 12 h. (d) Bax+/+Bak+/+ (WT) and Bax-/-Bak-/- (DKO) MEFs were cultured in EBSS in the presence of 50 μM z-VAD-fmk or control DMSO for 0, 6 or 12 h.
Figure 2
Figure 2
Inhibition of autophagy enhances caspase-3 activation, but suppresses caspase-independent cell death. (a, b) Bif-1 WT and KO MEFs or Bax/Bak WT and DKO MEFs were infected with shBECN1 or control shSCR lentiviruses. Twenty-four hours after infection, the medium was replaced with fresh culture medium and the cells were allowed to recover for an additional 48 h. The cells were then cultured in EBSS for 0, 6 or 12 h, and the percentage of dead cells was determined by trypan blue exclusion assay (mean ± s.d.; n = 3). Knockdown of Beclin 1 expression was confirmed by immunoblot analysis (insets). (c, d) Bif-1 WT and KO MEFs were pre-treated with 10 mM 3-methyladenine (3-MA), 0.2 μM wortmannin (WM) or control DMSO for 30 min followed by culture in EBSS for the indicated times. The percentage of dead cells was determined by trypan blue exclusion assay (mean ± s.d.; n = 3). Immunoblot analyses were performed to detect LC3 modification and caspase-3 activation. (e) Atg5 +/+ and -/- MEFs were cultured in EBSS in the presence of 50 μM of z-VAD-fmk or control DMSO for 0, 6 or 12 h. The percentage of dead cells was determined by trypan blue exclusion assay (mean ± s.d.; n = 3). (f) Total cell lysates (TCL) were prepared from Atg5 +/+ and -/- MEFs cultured in EBSS for the indicated times and subjected to immunoblot analyses. The full scans of the immunoblots shown in a, b, d and f are presented in the Supplementary Information, Fig. S5.
Figure 3
Figure 3
Loss of Bif-1 inhibits autophagy. (a) Bif-1 WT and KO MEFs were cultured in complete medium (CM) or EBSS for 3 h and analyzed by transmission electron microscopy. Arrows indicate autophagosomes. The number of autophagosomes per cross-sectioned cell was counted (mean ± s.d.; n = 42). (b) Bif-1 WT and KO MEFs were transfected with GFP-LC3, cultured in EBSS or CM for 3 h, then analyzed by fluorescent microscopy. Scale bars indicate 10 μm. The number of GFP-LC3 dots per GFP-positive cell was counted (mean ± s.d.; n = 35). (c) Bif-1 WT (W) and KO (K) MEFs were cultured in EBSS for the indicated times and subjected to immunoblot analysis with anti-LC3, α-tubulin and β-actin antibodies. (d) Bif-1 KO MEFs stably transfected with a Bif-1 expression plasmid or control empty vector were cultured in EBSS for 0, 3 or 6 h and subjected to immunoblot analysis. The immunoblotting results of LC3 in c and d were quantified as the percentage of LC3-II out of total LC3 (LC3-I + LC3-II) and are represented in bar graphs. (e) Stable shBif-1 expressing clones or control HeLa cells transfected with GFP-LC3 were cultured in CM or EBSS for 2 h and analyzed by fluorescent microscopy. The number of GFP-LC3 dots per GFP-positive cell was quantified (mean ± s.d.; n = 66). (f) Bif-1 knockdown HeLa cells were transfected with GFP-LC3 in combination with shBif-1 resistant Bif-1-HcRed, Bif-1ΔBAR-HcRed or empty HcRed vector for 20 h. The cells were then cultured in EBSS or CM for 2 h and the number of GFP-LC3 dots per HcRed-positive cell was determined using a fluorescent microscope (mean ± s.d.; n = 35). Statistical significance in a, b, e and f was determined by Student's t test. The full scans of the immunoblots shown in c, d and e are presented in the Supplementary Information, Fig. S5.
Figure 4
Figure 4
Bif-1 localizes to autophagosomes. (a) COS7 cells were transfected with Bif-1-HcRed together with GFP-Atg5 or GFP-LC3. Twenty hours after transfection, the cells were cultured in EBSS or CM for 2 h and subjected to confocal microscopic analysis. Magnified images are shown as insets. Representative Bif-1-Atg5 or Bif-1-LC-3 double positive foci are indicated by arrows. Scale bars in the insets are 1 μm. (b) COS7 cells transfected with Bif-1-GFP were cultured in EBSS for 2 h and the localization of Bif-1-GFP was examined by immunogold electron microscopy using anti-GFP antibody. Arrows indicate representative gold particles that are detected on autophagosomal membranes.
Figure 5
Figure 5
Bif-1 interacts with Beclin 1 through UVRAG. (a) Bif-1 WT and KO MEFs were cultured in EBSS for 0 or 6 h and subjected to immunoprecipitation with anti-Bif-1 monoclonal antibody. The resulting immune complexes and TCL were analyzed by immunoblotting with the indicated antibodies. (b) 293T cells were co-transfected with the indicated plasmids for 24 h and subjected to immunoprecipitation with anti-Flag monoclonal antibody. The resulting immune complexes and TCL were analyzed by immunoblotting with anti-Myc or anti-Flag polyclonal antibodies. (c) 293T cells were co-transfected with the indicated plasmids for 22 h, starved in EBSS for 2 h and subjected to immunoprecipitation with anti-Flag monoclonal antibody. The resulting immune complexes and TCL were analyzed by immunoblotting with anti-Myc or anti-Flag polyclonal antibodies. (d) 293T cells were transfected with siGFP or siUVRAG for 24 h, starved in EBSS for 2 h and subjected to immunoprecipitation with anti-Bif-1 monoclonal antibody. The resulting immune complexes and TCL were analyzed by immunoblotting with anti-Bif-1 and Beclin 1 polyclonal antibodies. The reduction of UVRAG protein expression by siUVRAG was confirmed by immunoprecipitation and immunoblot analysis with anti-UVRAG polyclonal antibody (Abgent). The full scans of immunoblots are presented in the Supplementary Information, Fig. S5.
Figure 6
Figure 6
Overexpression of the SH3 domain of Bif-1 but not of Endophilin A1 suppresses autophagosome formation. (a) HeLa cells were transfected with 0.2 μg of GFP-LC3 and 0, 0.2 or 0.6 μg of Bif-1(SH3)-Myc expression plasmids for 24 h. The total amount of plasmid DNA was adjusted at 0.8 μg per transfection with the pcDNA3 vector. The cells were then cultured in EBSS or CM for 3 h and the number of GFP-LC3 dots per GFP-positive cell was determined using a fluorescent microscope (mean ± s.d.; n = 40). (b) HeLa cells were transfected with GFP-LC3 in combination with either Bif-1 (SH3)-HcRed, Endophilin A1 (SH3)-HcRed or empty HcRed vector for 20 h. The cells were then cultured in EBSS or CM for 2 h and the number of GFP-LC3 dots per HcRed-positive cell was counted using a fluorescent microscope (mean ± s.d.; n = 46). Statistical significance in a and b was determined by Student's t test (* p < 0.0001). (c) 293T cells were transfected with the indicated plasmids for 24 h and subjected to immunoprecipitation with anti-Flag monoclonal antibody. The resulting immune complexes and TCL were analyzed by immunoblotting with anti-Myc and anti-Flag polyclonal antibodies. The full scans of the immunoblots shown in c are presented in the Supplementary Information, Fig. S5.
Figure 7
Figure 7
Loss of Bif-1 suppresses PI3KC3 activation during nutrient starvation. (a) Bif-1 WT and KO MEFs were transfected with Flag-PI3KC3, then incubated in CM or EBSS for 2 h and subjected to an in vitro PI3KC3 kinase assay. The expression of Flag-PI3KC3 was confirmed by immunoblot analysis (left panel). A representative autoradiograph is shown (middle panel). The results were quantified by phosphoimaging with a Typhoon scanner and shown as fold activation (right panel). The data are presented as means ± s.d. of five independent experiments. (b) Bif-1 WT and KO MEFs were transfected with p40(phox) PX-EGFP, cultured in CM or EBSS for 2 h and analyzed by fluorescent microscopy. The number of p40(phox) PX-EGFP-positive vesicles per cell was counted (mean ± s.d.; n = 35). Statistical significance in a and b was determined by Student's t test. (c) Stable shBif-1 clones or control HeLa cells were transfected with Flag-PI3KC3 alone or in combination with Flag-tagged Beclin 1 and UVRAG for 48 h and subjected to an in vitro PI3KC3 lipid kinase assay. The results were quantified and are shown as relative activities (mean ± s.d.; n = 3). (d) 293T cells were co-transfected with Flag-PI3KC3 and either wild type Bif-1, Bif-1ΔSH3 or control empty vector for 24 h and subjected to an in vitro PI3KC3 kinase assay (mean ± s.d.; n = 3). (e) Schematic representation of the Bif-1-UVRAG-Beclin 1-PI3KC3 protein complex.
Figure 8
Figure 8
Knockout of Bif-1 enhances spontaneous tumorigenesis in mice. (a) Bif-1 -/- mice exhibit moderate splenomegaly. The weight of spleens extirpated from Bif-1 +/+ (n = 27) and -/- (n = 34) mice (6 to 18 months old) was measured. Statistical significance was determined by Wilcoxon rank test. (b) Hematoxylin and eosin staining of tumor tissues. Tumors were observed in 3 of 21 (14.3%) and 26 of 29 (89.7%) autopsied Bif-1 wild type and knockout mice, respectively. Scale bars indicate 50 μm.

Comment in

Similar articles

Cited by

References

    1. Yoshimori T. Autophagy: a regulated bulk degradation process inside cells. Biochem Biophys Res Commun. 2004;313:453–8. - PubMed
    1. Levine B, Klionsky DJ. Development by self-digestion: molecular mechanisms and biological functions of autophagy. Dev Cell. 2004;6:463–77. - PubMed
    1. Shintani T, Klionsky DJ. Autophagy in health and disease: a double-edged sword. Science. 2004;306:990–5. - PMC - PubMed
    1. Gozuacik D, Kimchi A. Autophagy as a cell death and tumor suppressor mechanism. Oncogene. 2004;23:2891–906. - PubMed
    1. Eskelinen EL. Maturation of autophagic vacuoles in Mammalian cells. Autophagy. 2005;1:1–10. - PubMed

Publication types

MeSH terms