

Contributions of intracellular loops 2 and 3 of the lutropin receptor in Gs coupling
- PMID: 17872379
- PMCID: PMC2194637
- DOI: 10.1210/me.2007-0352
Contributions of intracellular loops 2 and 3 of the lutropin receptor in Gs coupling
Abstract
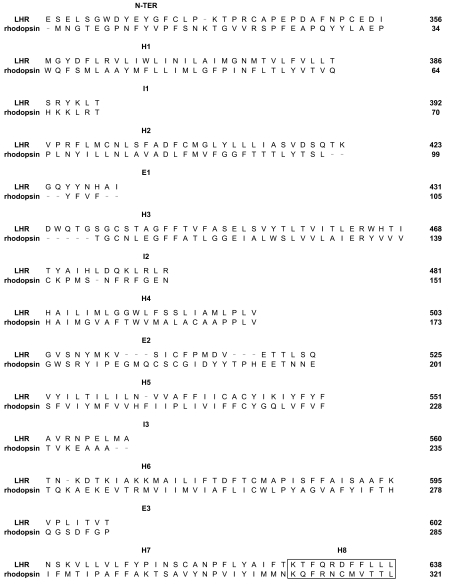
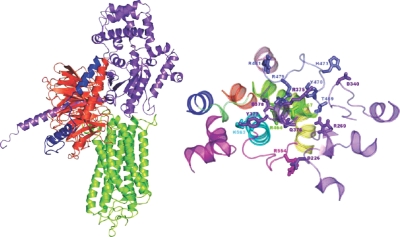
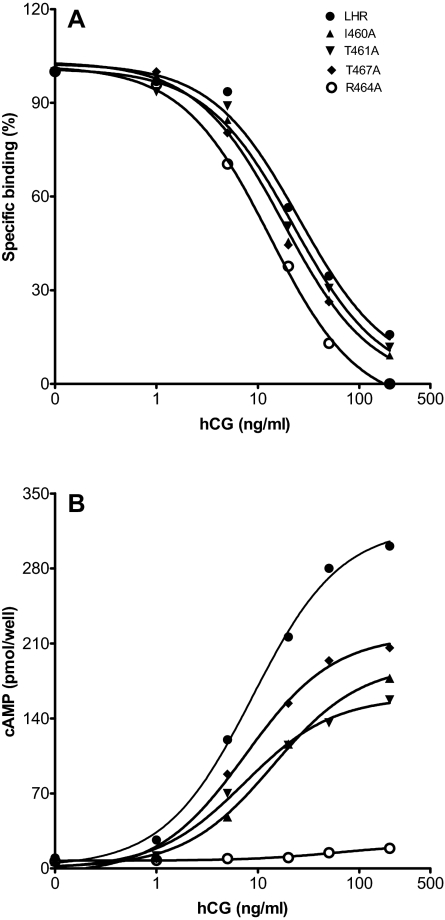
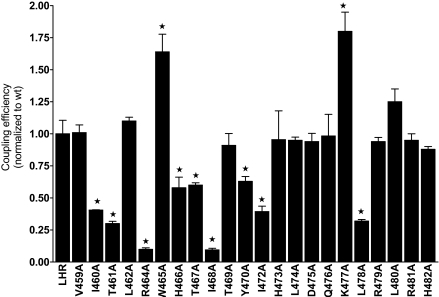
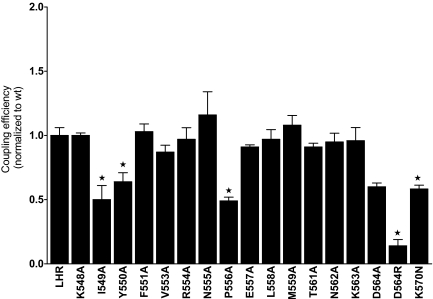
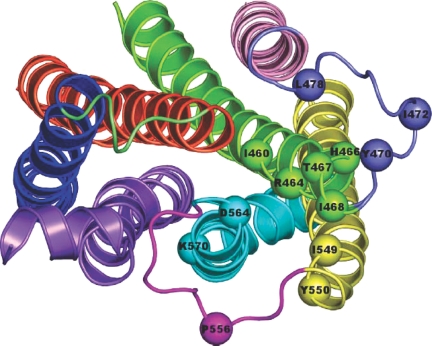
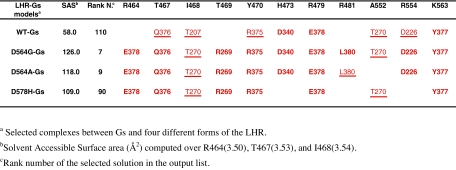
A number of amino acids essential for Gs coupling, i.e. hot spots, were identified after in vitro Ala-scanning mutagenesis of the cytosolic extensions of helices 3, 5, and 6 and of intracellular loops 2 and 3 (IL2 and IL3) of the human LH receptor (LHR). Consistent with the results of in vitro experiments involving ligand binding and ligand-mediated signaling in transiently transfected human embryonic kidney 293 cells, computational modeling of the isolated receptor and of the receptor-G protein complexes suggests an important role of the cytosolic extension of helix 3 and the N-terminal portion of the IL2 in Gs(alpha) interaction, whereas the contribution of IL3 is marginal. Mapping the hot spots into the computational models of LHR and the LHR-Gs complexes allowed for a distinction between receptor sites required for intramolecular structural changes (i.e. I460, T461, H466, and I549) and receptor sites more likely involved in G protein recognition (i.e. R464, T467, I468, Y470, Y550, and D564). The latter sites include the highly conserved arginine of the (E/D)R(Y/W) motif, which is therefore likely to be a receptor recognition point for Gs rather than a switch of receptor activation. The results of in vitro and in silico experiments carried out in this study represent the first comprehensive delineation of functionality of the individual residues in the intracellular domains of LHR and establish potential switches of receptor activation as well as a map of the primary receptor recognition sites for Gs. A novel way to consider constitutively active mutants was inferred from this study, i.e. receptor states with improved complementarity for the G protein compared to the wild-type receptor.
Figures
Similar articles
-
Characterization of a region of the lutropin receptor extracellular domain near transmembrane helix 1 that is important in ligand-mediated signaling.Endocrinology. 1999 Apr;140(4):1775-82. doi: 10.1210/endo.140.4.6624. Endocrinology. 1999. PMID: 10098515
-
Insight into mutation-induced activation of the luteinizing hormone receptor: molecular simulations predict the functional behavior of engineered mutants at M398.Mol Endocrinol. 2004 Jun;18(6):1499-508. doi: 10.1210/me.2003-0050. Epub 2004 Mar 11. Mol Endocrinol. 2004. PMID: 15016840
-
Functional role of transmembrane helix 7 in the activation of the heptahelical lutropin receptor.Mol Endocrinol. 2000 Apr;14(4):459-71. doi: 10.1210/mend.14.4.0439. Mol Endocrinol. 2000. PMID: 10770485
-
Structure-function relationships of the luteinizing hormone receptor.Ann N Y Acad Sci. 2005 Dec;1061:41-54. doi: 10.1196/annals.1336.006. Ann N Y Acad Sci. 2005. PMID: 16467256 Review.
-
A functional transmembrane complex: the luteinizing hormone receptor with bound ligand and G protein.Mol Cell Endocrinol. 2007 Jan 2;260-262:126-36. doi: 10.1016/j.mce.2006.05.009. Epub 2006 Oct 23. Mol Cell Endocrinol. 2007. PMID: 17059864 Free PMC article. Review.
Cited by
-
Mutation analysis of the LH receptor gene in Leydig cell adenoma and hyperplasia and functional and biochemical studies of activating mutations of the LH receptor gene.J Clin Endocrinol Metab. 2011 Jul;96(7):E1197-205. doi: 10.1210/jc.2010-3031. Epub 2011 Apr 13. J Clin Endocrinol Metab. 2011. PMID: 21490077 Free PMC article.
-
Structure-Function Relationships of the Follicle-Stimulating Hormone Receptor.Front Endocrinol (Lausanne). 2018 Nov 29;9:707. doi: 10.3389/fendo.2018.00707. eCollection 2018. Front Endocrinol (Lausanne). 2018. PMID: 30555414 Free PMC article. Review.
-
Research resource: Update and extension of a glycoprotein hormone receptors web application.Mol Endocrinol. 2011 Apr;25(4):707-12. doi: 10.1210/me.2010-0510. Epub 2011 Feb 3. Mol Endocrinol. 2011. PMID: 21292827 Free PMC article.
-
Target flexibility: an emerging consideration in drug discovery and design.J Med Chem. 2008 Oct 23;51(20):6237-55. doi: 10.1021/jm800562d. Epub 2008 Sep 12. J Med Chem. 2008. PMID: 18785728 Free PMC article. No abstract available.
-
Conserved amino acids participate in the structure networks deputed to intramolecular communication in the lutropin receptor.Cell Mol Life Sci. 2011 Apr;68(7):1227-39. doi: 10.1007/s00018-010-0519-z. Epub 2010 Sep 11. Cell Mol Life Sci. 2011. PMID: 20835841 Free PMC article.
References
-
- Fredriksson R, Lagerstrom MC, Lundin LG, Schioth HB 2003 The G-protein-coupled receptors in the human genome form five main families. Phylogenetic analysis, paralogon groups, and fingerprints. Mol Pharmacol 6:1256–1272 - PubMed
-
- Bourne HR 1997 How receptors talk to trimeric G proteins. Curr Opin Cell Biol 9:134–142 - PubMed
-
- Fanelli F, De Benedetti PG 2005 Computational modeling approaches to structure-function analysis of G protein-coupled receptors. Chem Rev 105:3297–3351 - PubMed
Publication types
MeSH terms
Substances
Grants and funding
LinkOut - more resources
Full Text Sources
Miscellaneous
