Modelling control measures to reduce the impact of pandemic influenza among schoolchildren
- PMID: 17850689
- PMCID: PMC2870896
- DOI: 10.1017/S0950268807009284
Modelling control measures to reduce the impact of pandemic influenza among schoolchildren
Abstract
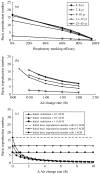
We coupled the Wells-Riley equation and the susceptible-exposed-infected-recovery (SEIR) model to quantify the impact of the combination of indoor air-based control measures of enhanced ventilation and respiratory masking in containing pandemic influenza within an elementary school. We integrated indoor environmental factors of a real elementary school and aetiological characteristics of influenza to estimate the age-specific risk of infection (P) and basic reproduction number (R(0)). We combined the enhanced ventilation rates of 0.5, 1, 1.5, and 2/h and respiratory masking with 60%, 70%, 80%, and 95% efficacies, respectively, to predict the reducing level of R0. We also took into account the critical vaccination coverage rate among schoolchildren. Age-specific P and R(0) were estimated respectively to be 0.29 and 16.90; 0.56 and 16.11; 0.59 and 12.88; 0.64 and 16.09; and 0.07 and 2.80 for five age groups 4-6, 7-8, 9-10, 11-12, and 25-45 years, indicating pre-schoolchildren have the highest transmission potential. We conclude that our integrated approach, employing the mechanism of transmission of indoor respiratory infection, population-dynamic transmission model, and the impact of infectious control programmes, is a powerful tool for risk profiling prediction of pandemic influenza among schoolchildren.
Figures


Similar articles
-
A probabilistic transmission dynamic model to assess indoor airborne infection risks.Risk Anal. 2005 Oct;25(5):1097-107. doi: 10.1111/j.1539-6924.2005.00663.x. Risk Anal. 2005. PMID: 16297217
-
Viral kinetics and exhaled droplet size affect indoor transmission dynamics of influenza infection.Indoor Air. 2009 Oct;19(5):401-13. doi: 10.1111/j.1600-0668.2009.00603.x. Epub 2009 Feb 28. Indoor Air. 2009. PMID: 19659895
-
Probabilistic indoor transmission modeling for influenza (sub)type viruses.J Infect. 2010 Jan;60(1):26-35. doi: 10.1016/j.jinf.2009.09.015. Epub 2009 Oct 7. J Infect. 2010. PMID: 19818365
-
Community-acquired respiratory viruses.Am J Transplant. 2004 Nov;4 Suppl 10(Suppl 10):105-9. doi: 10.1111/j.1600-6135.2004.00734.x. Am J Transplant. 2004. PMID: 15504224 Free PMC article. Review. No abstract available.
-
Herd protection against influenza.J Clin Virol. 2006 Dec;37(4):237-43. doi: 10.1016/j.jcv.2006.08.020. Epub 2006 Sep 26. J Clin Virol. 2006. PMID: 17008123 Review.
Cited by
-
Review of economic evaluations of mask and respirator use for protection against respiratory infection transmission.BMC Infect Dis. 2015 Oct 13;15:413. doi: 10.1186/s12879-015-1167-6. BMC Infect Dis. 2015. PMID: 26462473 Free PMC article. Review.
-
Ventilation does not affect close-range transmission of influenza virus in a ferret playpen setup.Proc Natl Acad Sci U S A. 2024 Aug 13;121(33):e2322660121. doi: 10.1073/pnas.2322660121. Epub 2024 Aug 6. Proc Natl Acad Sci U S A. 2024. PMID: 39361828 Free PMC article.
-
The burden of seasonal and pandemic influenza in infants and children.Eur J Pediatr. 2014 Mar;173(3):265-76. doi: 10.1007/s00431-013-2023-6. Epub 2013 May 10. Eur J Pediatr. 2014. PMID: 23661234 Free PMC article.
-
The Influence of Ventilation Measures on the Airborne Risk of Infection in Schools: A Scoping Review.Int J Environ Res Public Health. 2023 Feb 20;20(4):3746. doi: 10.3390/ijerph20043746. Int J Environ Res Public Health. 2023. PMID: 36834438 Free PMC article.
-
Cost-effectiveness of influenza control measures: a dynamic transmission model-based analysis.Epidemiol Infect. 2013 Dec;141(12):2581-94. doi: 10.1017/S0950268813000423. Epub 2013 Mar 12. Epidemiol Infect. 2013. PMID: 23481024 Free PMC article.
References
-
- WHO http://www.who.int/mediacentre/factsheets/fs211/en/index.html. 2003. http://www.who.int/mediacentre/factsheets/fs211/en/index.html . Influenza fact sheet ( ). World Health Organization,
-
- Turner D et al. Systematic review and economic decision modeling for the prevention and treatment of influenza A and B. Health Technology Assessment. 2003;7:1–170. - PubMed
-
- Emanuel EJ, Wertheimer A. Who should get influenza vaccine when not all can? Science. 2006;312:854–855. - PubMed
MeSH terms
Substances
LinkOut - more resources
Full Text Sources
Medical

