. 2007 Aug;3(8):e169.
doi: 10.1371/journal.pcbi.0030169. Epub 2007 Jul 18.

A numerical approach to ion channel modelling using whole-cell voltage-clamp recordings and a genetic algorithm

Affiliations

A numerical approach to ion channel modelling using whole-cell voltage-clamp recordings and a genetic algorithm

Meron Gurkiewicz et al. PLoS Comput Biol. 2007 Aug.

Abstract

The activity of trans-membrane proteins such as ion channels is the essence of neuronal transmission. The currently most accurate method for determining ion channel kinetic mechanisms is single-channel recording and analysis. Yet, the limitations and complexities in interpreting single-channel recordings discourage many physiologists from using them. Here we show that a genetic search algorithm in combination with a gradient descent algorithm can be used to fit whole-cell voltage-clamp data to kinetic models with a high degree of accuracy. Previously, ion channel stimulation traces were analyzed one at a time, the results of these analyses being combined to produce a picture of channel kinetics. Here the entire set of traces from all stimulation protocols are analysed simultaneously. The algorithm was initially tested on simulated current traces produced by several Hodgkin-Huxley-like and Markov chain models of voltage-gated potassium and sodium channels. Currents were also produced by simulating levels of noise expected from actual patch recordings. Finally, the algorithm was used for finding the kinetic parameters of several voltage-gated sodium and potassium channels models by matching its results to data recorded from layer 5 pyramidal neurons of the rat cortex in the nucleated outside-out patch configuration. The minimization scheme gives electrophysiologists a tool for reproducing and simulating voltage-gated ion channel kinetics at the cellular level.


Conflict of interest statement

Competing interests. The authors have declared that no competing interests exist.

Figures

Figure 1
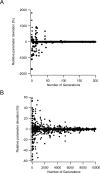
Figure 1. Progression of the Best Individual
(A) The relative changes in the values of the parameters in the best individual were calculated by the following equation F = 100 · (Pj ,NPj ,N−1)/Pj ,N−1 where Pj ,N denotes the value of the j th parameter of the best individual in generation N and Pj ,N−1 denotes the value of the same parameter in the previous generation. The values were multiplied by 100 to display percentage changes. The graph contains the analysis of all parameters in a nine-parameter model without differentiating between them. (B) Same graph as in (A) with a longer generation scale and a zoom in on the parameter deviation scale.
Figure 2
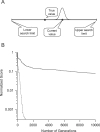
Figure 2. Modification of the Genetic Algorithm
(A) A schematic drawing of the changes made to the GA as described in the text. (B) Convergence of the GA when the algorithm searched the entire search domain (smooth line) and when the search domain was focused around the current best values 200 generations after the start of the search (dashed line).
Figure 3
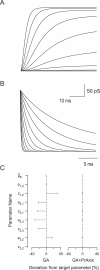
Figure 3. Constraining a Nine-Parameter Voltage-Gated K+ Channel Model
(A) Activation of the conductance of Model A (see Methods) simulated in response to depolarizing voltage steps from −40 to +60 mV in steps of 20 mV. (B) Deactivation of the conductance of Model A. Following a 20-ms activation to +60 mV, deactivation was simulated by lowering potential to −120 mV to −20 mV in steps of 10 mV. (C) The errors in the best parameter set obtained by the GA (left) and GA followed by PrAxis (right) are plotted relative to their target values (dotted lines).
Figure 4
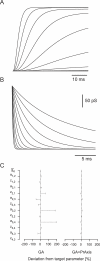
Figure 4. Constraining a 13-Parameter Voltage-Gated K+ Channel Model
(A) Activation of the conductance of Model B (see Methods) simulated in response to depolarizing voltage steps from −40 to +60 mV in steps of 20 mV. (B) Deactivation of the conductance of Model A. Following a 20 ms activation to +60 mV, deactivation to potentials ranging from −120 to −20 mV in steps of 10 mV was simulated. (C) The errors in the best parameter set obtained by the GA (left) and GA followed by PrAxis (right) plotted relative to their target values (dotted lines).
Figure 5
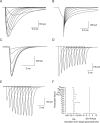
Figure 5. Constraining a 15-Parameter Model of a Voltage-Gated Na+ Channel
(A) Simulated activation of a Hodgkin-Huxley–like model of the voltage-gated Na+ current (Model C, [24]) in response to depolarizing voltage commands. (B) Simulated deactivation protocol. (C) Simulated steady-state inactivation. (D) Simulated pulse inactivation. (E) Simulated recovery from inactivation. (F) The errors in the best parameter set obtained by the GA (left) and GA followed by PrAxis (right) plotted relative to their target values (dotted lines).
Figure 6
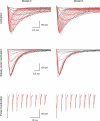
Figure 6. Fitting a Model to Experimentally Recorded Voltage-Gated Na+ Currents from Neocortical Pyramidal Neurons
Results of fitting a dataset containing three pulse protocols to two models, Model D [25], left column, and Model E [16], right column. Data are shown as black lines, the fit in red. Pre-pulses and long stretches of data recorded at the holding potential were removed from the data traces to reduce possible bias to the fit. The activation traces (top traces) are inward currents recorded from a nucleated patch. A 100-ms pulse to −110 mV followed by a 20-ms pulse to voltages between −30 and +35 mV at 5-mV increments. Steady-state inactivation is shown in the middle traces. The inward currents were generated by a 20-ms voltage step to zero following a 100-ms pre-pulse to voltages between −105 mV and −5 mV at 10-mV increments. In pulse inactivation (bottom traces), the inward currents were generated in response to a voltage step to −50 mV (following a 100-ms pre-pulse to −110 mV) for varying durations from 0 ms to 45 ms in increments of 5 ms, followed by another voltage step to 0 ms for 30 ms. Data in all traces were filtered at 10 kHz and sampled at 20 kHz. The parameters generating the fit of Model D were: gNa,act = 20.65; gNa,SSI = 20.44; gNa,onset = 12.15; a1,2 = 12.27; z1,2 = 0.038; a2,1 = 0.01; z2,1 = 0.246; a2,3a = 21.55; a2,3b = 1.42; z2,3 = 0.130; a3,2a = 1428; a3,2b = 234.5; z3,2 = 0.0047; a1,4a = 3.9; a1,4b = 1.72; z1,4 = 0.08; a4,1 = 0.015; z4,1 = 0.031; and ENa=59.7 mV.
Figure 7
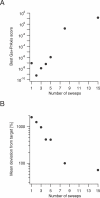
Figure 7. Effect of Increasing Number of Sweeps on GA Performance
(A) Best GA and PrAxis fit function score versus an increasing number of activation stimulation sweeps using Model B (as depicted in Figure 4A). (B) Mean deviation of calculated parameter values from their target values versus increasing number of activation stimulation sweeps.
Figure 8
Figure 8. Effect of Noise on GA Performance
The errors in the best parameter set obtained by the GA followed by PrAxis plotted relative to their target values (dotted lines) for three cases of increasing white noise added to the simulated currents.
Figure 9
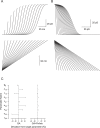
Figure 9. Constraining a Model Using Voltage Ramps
(A) The activation (top traces) of a nine-parameter model of a voltage-gated K+ channel (Model A) in response to ramps from −100 mV to +50 mV with varying duration (bottom traces). (B) The response of the same model to deactivating voltage ramps from +50 to −100 mV (following a 50-ms step to +50 mV to allow for full-channel activation). (C) The errors in the best parameter set obtained by the GA (left) and GA followed by PrAxis (right) plotted relative to their target values (dotted lines).
Figure 10
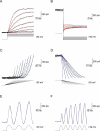
Figure 10. Fitting a Model to Experimentally Recorded Voltage-Gated K+ Currents from Neocortical Pyramidal Neurons
(A) Outward currents recorded from a nucleated patch. 400-ms pulse to −110 mV followed by a 90-ms pulse to voltages between −80 mV and +80 mV at 20-mV increments. The −110 mV pre-pulse was truncated to facilitate the display of the outward current. Sampled at 20 kHz and filtered at 5 kHz. Leak was subtracted off-line. The red lines are the fit obtained by GA followed by PrAxis for a model with two closed states and one open state (see the text and Table 1). (B) The outward current was generated by a 20-ms voltage step to +80 mV following a 400-ms pre-pulse to −110 mV (truncated). The voltage was then stepped from −120 mV in steps of 10 mV to record the deactivation kinetics. The bath solution contained 10 mM 4-AP and 65 mM K+. Leak was subtracted off-line. Filtered at 10 kHz and sampled at 50 kHz. The red lines are the fit obtained by GA followed by PrAxis for a model with two closed states and one open state (see the text and Table 1). The parameters that generated the fit of Model A were: gK,act = 5.95; gK,deact = 4.52; a1,2 = 0.07; z1,2 = 0.041; a2,1 = 0.434; z2,1 = 0.021; a2,3 = 0.056; z2,3 = 0.025; a3,2 = 0.011; and z3,2 = 0.0317. (C) The outward current was generated by a 500-ms pulse to −100 mV (truncated) followed by voltage ramps to +40 mV. Ramp duration started at 40-ms duration and was increased in steps of 10 ms. The blue lines are the simulated currents produced in response to an identical protocol using Model A with the parameter values detailed in (B). (D) The outward current was generated by deactivating voltage ramps from +40 mV to −80 mV. Ramp duration started at 2 ms and increased in steps of 5 ms (following a 40-ms step to +40 mV to allow for full-channel activation). The blue lines are the simulated currents produced in response to an identical protocol using Model A with the parameter values detailed in (B). Filtered at 5 kHz and sampled at 10 kHz. (E) The outward current was generated using a sinusoidal voltage change following a 600-ms pre-pulse to −100 mV (truncated). The sine wave ranged from +70 mV to −70 mV with a frequency of 50 Hz. The blue lines are the simulated currents produced in response to an identical protocol using Model A with the parameter values detailed in (B). Filtered at 5 kHz and sampled at 10 kHz. (F) The outward current was generated using a sinusoidal voltage change following a 600-ms pre-pulse to −100 mV (truncated). The sine wave ranged between +70 mV to −70 mV with a frequency of 100 Hz. The blue lines are the simulated currents produced in response to an identical protocol using Model A with the parameter values detailed in (B). Filtered at 5 kHz and sampled at 10 kHz.

Similar articles

Cited by

References

    1. Bean BP. The action potential in mammalian central neurons. Nat Rev Neurosci. 2007;8:451–465. - PubMed
    1. Llinás RR. The intrinsic electrophysiological properties of mammalian neurons: Insights into central nervous system function. Science. 1988;242:1654–1664. - PubMed
    1. Hodgkin AL, Huxley AF. A quantitative description of membrane current and its application to conduction and excitation in nerve. J Physiol. 1952;117:500–544. - PMC - PubMed
    1. Hodgkin AL, Huxley AF. The dual effect of membrane potential on sodium conductance in the giant axon of Loligo. J Physiol. 1952;116:497–506. - PMC - PubMed
    1. Hodgkin AL, Huxley AF. The components of membrane conductance in the giant axon of Loligo. J Physiol. 1952;116:473–496. - PMC - PubMed

Publication types

LinkOut - more resources