. 2007 Sep 3;204(9):2171-85.
doi: 10.1084/jem.20070567. Epub 2007 Aug 27.

Progressive CD4+ central memory T cell decline results in CD4+ effector memory insufficiency and overt disease in chronic SIV infection

Affiliations

Progressive CD4+ central memory T cell decline results in CD4+ effector memory insufficiency and overt disease in chronic SIV infection

Afam Okoye et al. J Exp Med. .

Erratum in

  • J Exp Med. 2007 Oct;204(10):2493

Abstract

Primary simian immunodeficiency virus (SIV) infections of rhesus macaques result in the dramatic depletion of CD4(+) CCR5(+) effector-memory T (T(EM)) cells from extra-lymphoid effector sites, but in most infections, an increased rate of CD4(+) memory T cell proliferation appears to prevent collapse of effector site CD4(+) T(EM) cell populations and acute-phase AIDS. Eventually, persistent SIV replication results in chronic-phase AIDS, but the responsible mechanisms remain controversial. Here, we demonstrate that in the chronic phase of progressive SIV infection, effector site CD4(+) T(EM) cell populations manifest a slow, continuous decline, and that the degree of this depletion remains a highly significant correlate of late-onset AIDS. We further show that due to persistent immune activation, effector site CD4(+) T(EM) cells are predominantly short-lived, and that their homeostasis is strikingly dependent on the production of new CD4(+) T(EM) cells from central-memory T (T(CM)) cell precursors. The instability of effector site CD4(+) T(EM) cell populations over time was not explained by increasing destruction of these cells, but rather was attributable to progressive reduction in their production, secondary to decreasing numbers of CCR5(-) CD4(+) T(CM) cells. These data suggest that although CD4(+) T(EM) cell depletion is a proximate mechanism of immunodeficiency, the tempo of this depletion and the timing of disease onset are largely determined by destruction, failing production, and gradual decline of CD4(+) T(CM) cells.


Figures

Figure 1.
Figure 1.
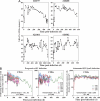
Relationship between pvl and survival in SIVmac239 infection. (A) Pvl data is shown for 14 SIVmac239-infected RMs that did not receive ART during their course and were followed to an AIDS endpoint. Profiles are color-coded according to time to endpoint as indicated. Note that the y axis starts at 102 copies/ml (the threshold sensitivity of the viral load assay) rather than 0 (acute-phase viral load data on these RM can be viewed in detail in reference 15). (B) The mean pvl for each RM from postinfection day (PID) 70 to either endpoint (rapid progressors) or PID 350 (normal progressors) is plotted against time to AIDS for all 14 RMs (left) or the 10 normal progressors alone (right). The graph configuration and color-coding are as described for A. Both linear regression (R) and Spearman rank (Rho) correlation coefficients and the p-values for these analyses are indicated in each plot. NS, nonsignificant.
Figure 2.
Figure 2.
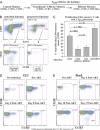
Systemic analysis of T cell populations in SIVmac239-infected RMs with overt immunodeficiency. (A) The absolute number of total, memory, and naive CD4+ and CD8+ T cells in the blood and the percent CD4+ T cells (of total CD3+) in BAL were evaluated by flow cytometry at the time of infection (baseline) and at an AIDS endpoint in 17 SIVmac239-infected RMs: 4 rapid progressors (red) and 13 normal progressors (black). Results are presented as percent change from baseline, with the significance of this change assessed separately for normal and rapid progressors using a mixed-effects statistical model. (B) The percent CD4+ of total T cells in BAL is plotted against the same measurement in small intestinal (jejunal) biopsy cell preparations from RMs with pulmonary lavage examination and small intestinal biopsy within 7 d of each other. The analysis includes 12 plateau-phase SIVmac239-infected RMs (red; median pvl = 550,000 copies/ml), 12 SIVmac239(Δnef)-infected RMs (light blue; median pvl = 180 copies/ml), and 15 SIV normal control RMs (dark blue). The plot shows a linear regression line with the correlation coefficient and p-value of the correlation indicated in the top left corner. (C) PLNs from 11 SIVmac239-infected normal progressors with AIDS and 10 SIV control RMs were analyzed by flow cytometry for evidence of relative CD4+ depletion in either the memory or naive compartments. CD3+ T cells, including both CD4+ and CD8+ lineages, were first separated into naive and memory compartments by phenotypic criteria (see Materials and methods), and then the relative fractions of CD4+ cells within these compartments were determined. Results are presented as percent CD4+ (of total naive or memory T cells). The red lines designate the mean percent CD4+ values, with significance of differences between SIV and SIV+ RMs determined by unpaired t test.
Figure 3.
Figure 3.
Kinetics of CD4+ T cell decline in the lung. BAL cell preparations were stained for CD3 and CD4, and the percent CD4+ T cells (of total CD3+ T cells) was determined by flow cytometry for eight SIVmac239-infected normal progressors that did not receive ART during their course and were followed to an AIDS endpoint (note that nearly all BAL T cells are TEM cell phenotype [18]). For each RM, the Δlog10(%CD4) per 100 d was determined from PID 100 to endpoint (“slope”), and the p-value of the regression line is designated in the top right corner of each profile. The pooled Δlog10(%CD4) per 100 d plus SEM for all eight RMs was −0.28 ± 0.04 (P = 0.0003), which corresponds to an average CD4+ T cell population half-life of 107 d (using the formula t1/2 = log10(0.5)/b, where b is the pooled slope estimate).
Figure 4.
Figure 4.
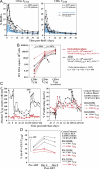
TEM cell dynamics in the pulmonary airspace. (A) An SIVmac239-infected normal progressor (RM no. 20955: PID 1,125; pvl = 69,000 copies/ml) was administered three intravenous doses (30 mg/kg) of BrdU over 24 h, and BAL samples were obtained before BrdU administration (day 0) and at subsequent intervals for flow cytometric analysis of BrdU incorporation in CD4+ T cells. The first post-BrdU sampling was 14 h after the last BrdU dose and is designated day 1. The percentage of total BrdU+ cells, Ki-67 BrdU+ cells, and Ki-67+ BrdU+ cells was determined at each time point. (B) BrdU was administered to and BAL samples were collected from four uninfected (control) RMs and four plateau-phase SIVmac239-infected RMs (RM no. 20955, as above; no. 21046: PID 1,125; pvl = 360,000 copies/ml; no. 21192: PID 456; pvl = 240,000 copies/ml; no. 21580: PID 876; pvl = 80,000 copies/ml) as described in A. The overall percent BrdU+ in BAL CD4+ and CD8+ T cell populations are shown. Differences in peak and plateau (day 42) labeling were determined by unpaired t test (p-values shown in the top right corner of each profile). (C) BrdU was administered to and BAL samples were collected from RM numbers 21046 and 20955 three successive times over the course of their SIVmac239 infection: Pre-ART (PID 577; pvls = 200,000 and 500,000 copies/ml, respectively; percent CD4+ in BAL = 0.41 and 1.7%, respectively); on stable ART (PID 764: pvls = 280 and <30 copies/ml, respectively; percent CD4+ in BAL = 19.7 and 9.6%, respectively), and 7 mo after ART discontinuation (PID 1,125; pvls = 360,000 and 69,000, respectively; percent CD4+ in BAL: 0.43 and 1.4%, respectively). The overall percent BrdU+ of BAL CD4+ and CD8+ T cell populations is shown. (D) CCR5 expression was determined by flow cytometry on the BrdU-labeled CD4+ and CD8+ T cells of the SIVmac239-infected RMs described in B. The fraction of BrdU+ CD4+ and CD8+ T cells expressing CCR5 is shown over time (*, insufficient cells for analysis). A random slope statistical model was used to determine the stability of CCR5 expression over time for the labeled CD4+ T cells. This analysis showed that (a) none of the individual slopes (loss of CCR5-expressing, BrdU+ CD4+ T cells in BAL over time) was statistically significant after adjusting for multiple comparisons, and (b) the overall slope (average loss per day among four animals) was not statistically significant.
Figure 5.
Figure 5.
Proliferating CD4+ and CD8+ memory T cell dynamics in the blood. (A) The fraction of proliferating cells (Ki-67+) is shown over the course of chronic/progressive SIVmac239 infection in four representative RMs that did not receive ART and were followed to an AIDS endpoint. (B) The absolute number of proliferating (Ki-67+) CD4+ and CD8+ memory T cells is shown for the entire course of SIVmac239 infection in the same group of untreated normal progressors described in Fig. 3, and for comparison, a group of SIV(Δnef)-infected nonprogressors followed for 600 d. The pooled Δlog10(%Ki-67+ memory T cells) per 100 d (± SEM) from PID 100 to endpoint (progressors) or PID 100–600 (nonprogressors) is shown for each analysis, along with the p-value delineating the statistical significance of these pooled slopes.
Figure 6.
Figure 6.
Effect of infection on CD4+ TEM cell differentiation from proliferating TCM cell precursors. (A) Schema of memory T cell differentiation in RMs (18). (B) The top profiles show CD4+ T cells from one RM with attenuated SIVmac239(Δnef) infection (PID 387; pvl = 5,200 copies/ml) and one with progressive SIVmac239 infection (PID 579; pvl = 3,800,000 copies/ml), indicating the gating of proliferating (Ki-67+) CD4+ memory T cells. The bottom profiles show the representation of TCM cells (CD28+; CCR5) versus total TEM cells (including CD28+, CCR5+ transitional TEM cells, and CD28/CCR5dim+ mature TEM cells) within the proliferating CD4+ memory compartment. (C) The figure shows cross-sectional analysis of the fractional representation of total TEM cells (as in A) in 10 SIV RMs, 7 RMs with early plateau-phase SIVmac239 infection (PID 105; median pvl = 5,300,000 copies/ml), 8 RMs with late plateau-phase SIVmac239 infection (PID 533–878; median pvl = 660,000 copies/ml), and 12 RMs with controlled SIV infection: 9 infected with SIVmac239(Δnef) (PID 154–390; pvls < 400 copies/ml) and 3 spontaneous controllers of SIVmac239 (PID 105–147: pvls < 4,000 copies/ml). Differences were assessed by unpaired t test. (D) The profiles show the fractional representation of TEM cells among proliferating (Ki-67+) CD4+ memory T cells from PLNs from an RM 5 d before SIVmac239 infection, at PID 150 (immediately before ART; pvl = 4,400,000 copies/ml), and at 4 (pvl = 180,000) and 8 d (pvl = 87,000) after ART initiation. (E) The profiles show the fractional representation of TEM cells among proliferating (Ki-67+) CD4+ memory T cells from the blood of an SIVmac239-infected RM at PID 105 (immediately before ART; pvl = 3,000,000 copies/ml) and days 4 (pvl = 220,000 copies/ml), 10 (pvl = 170,000 copies/ml), and 17 (pvl = 24,000 copies/ml) after ART. The arrow indicates the development of a fully mature CD4+ TEM cell population.
Figure 7.
Figure 7.
Effect of infection on CD4+ TCM cell homeostasis. (A) BrdU was administered to and blood samples were collected from five uninfected (control) RMs and five late plateau-phase SIVmac239-infected RMs (PID 466–1125; median pvl = 240,000 copies/ml) as described in Fig. 4. The overall percent BrdU+ was determined by flow cytometry on CD95+, CD28+, and CCR5 TCM cells, both CD4+ and CD8+, at the time points shown. Data from all 10 RMs are included in the CD4+ TCM cell analysis. As one SIV+ RM had insufficient numbers of evaluable CD8+ TCM cells, only four SIV+ RMs are included in the CD8+ TCM cell analysis. (B) CD4+ and CD8+ TCM cells (CD95+, CD28+, CCR5, CCR7+) and CD4+ transitional TEM cells (CD95+, CD28+, CCR5+) were sorted from splenic mononuclear cell preparations taken at necropsy from eight SIVmac239-infected RMs (four with early [asymptomatic] plateau-phase infection [PID 78–85] and four with chronic-onset AIDS [PID 372, 483, 554, and 1,157]) and assessed for SIV DNA content. The average pvl and percent Ki-67+ within the splenic CD4+ TCM cells from each RM group are also shown. The significance of differences was assessed by unpaired t test. (C) The absolute number and fractional proliferation (percent Ki-67+) of highly defined CD4+ and CD8+ TCM cells in the blood are shown for two representative SIVmac239-infected RMs through early plateau phase and after ART. The median pre-ART plateau-phase pvls in both of these RMs were ∼4,000,000 copies/ml, with ART decreasing these values to 22,000 and 50,000 copies/ml for RM numbers 23788 and 23892, respectively. (D) Three SIVmac239-infected RMs were treated with ART at PID 132 (no. 23186) or PID 153 (nos. 23208 and 23186) with PLN biopsy immediately before and 4 and 8 d after ART (mean pre-ART and post-ART days 4 and 8; pvls = 6,000,000, 237,000, and 56,000 copies/ml, respectively). The proliferating fraction (percent Ki-67+) of CD4+ and CD8+ TCM cells from each of these PLN biopsies is shown (with differences between post-ART change in percent Ki-67+ of CD4+ and CD8+ TCM cells evaluated by paired t test).
Figure 8.
Figure 8.
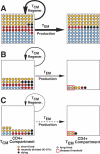
The descent to AIDS: decreasing numbers and changing proportions of CD4+ memory T cell populations in chronic SIVmac239 infection. The figure schematically illustrates the progressive decline in the regeneration of long-lived TCM cells and, consequently, in the production of short-lived, tissue-seeking TEM cells. The TCM cell compartment consists of TCM cells in secondary lymphoid tissues and recirculating in the blood. The TEM cell compartment represents cells resident in extra-lymphoid effector sites. Estimated populations include: (a) recently divided (Ki-67+) cells (cells that have been in S-phase of the cell cycle in the preceding week), (b) short-lived cells (Ki-67 cells destined to die or resume division in <2–3 wk), (c) long-lived cells (Ki-67 cells destined to live >3 wk without cell division), and (d) dying cells (either apoptosis or direct viral destruction). The left to right horizontal arrows indicate the relative rate of production and effector site emigration of TEM cells. The semicircular arrow adjacent to the TCM cell compartment indicates the relative efficiency of TCM cell regeneration (note that proliferating TCM cells provide the substrate for both TCM cell regeneration and TEM cell production). (A) Preinfection baseline. Both TCM and TEM cell compartments include relatively large proportions of long-lived cells. (B) Asymptomatic chronic phase—mid-course. Both compartments have experienced dramatic acute-phase depletion (TEM > TCM) and have established a quasi-stable steady-state with substantially reduced cell numbers, especially of long-lived cells, and increased proliferation and death rates. Both TCM cell regeneration and TEM cell production are reduced severalfold from baseline, despite the increased proportion of proliferating TCM cells, but this fractional increase in a reduced compartment is still sufficient to maintain predominantly short-lived TEM cell populations above the immune deficiency threshold. (C) End-stage chronic phase—AIDS onset. Progressive decline in the TCM cell compartment has reduced TEM cell production and delivery to effector sites below the minimum necessary to maintain TEM cell populations above threshold, leaving these sites increasingly susceptible to opportunistic infection.

Similar articles

Cited by

References

    1. Simon, V., D.D. Ho, and Q. Abdool Karim. 2006. HIV/AIDS epidemiology, pathogenesis, prevention, and treatment. Lancet. 368:489–504. - PMC - PubMed
    1. Pantaleo, G., C. Graziosi, J.F. Demarest, L. Butini, M. Montroni, C.H. Fox, J.M. Orenstein, D.P. Kotler, and A.S. Fauci. 1993. HIV infection is active and progressive in lymphoid tissue during the clinically latent stage of disease. Nature. 362:355–358. - PubMed
    1. Mellors, J.W., C.R. Rinaldo Jr., P. Gupta, R.M. White, J.A. Todd, and L.A. Kingsley. 1996. Prognosis in HIV-1 infection predicted by the quantity of virus in plasma. Science. 272:1167–1170. - PubMed
    1. Detels, R., A. Munoz, G. McFarlane, L.A. Kingsley, J.B. Margolick, J. Giorgi, L.K. Schrager, and J.P. Phair. 1998. Effectiveness of potent antiretroviral therapy on time to AIDS and death in men with known HIV infection duration. Multicenter AIDS Cohort Study Investigators. JAMA. 280:1497–1503. - PubMed
    1. Levy, J.A. 1993. Pathogenesis of human immunodeficiency virus infection. Microbiol. Rev. 57:183–289. - PMC - PubMed

Publication types

MeSH terms