. 2007;35(17):5729-47.
doi: 10.1093/nar/gkm561. Epub 2007 Aug 23.

Replication fork regression in vitro by the Werner syndrome protein (WRN): holliday junction formation, the effect of leading arm structure and a potential role for WRN exonuclease activity

Affiliations

Replication fork regression in vitro by the Werner syndrome protein (WRN): holliday junction formation, the effect of leading arm structure and a potential role for WRN exonuclease activity

Amrita Machwe et al. Nucleic Acids Res. 2007.

Abstract

The premature aging and cancer-prone disease Werner syndrome stems from loss of WRN protein function. WRN deficiency causes replication abnormalities, sensitivity to certain genotoxic agents, genomic instability and early replicative senescence in primary fibroblasts. As a RecQ helicase family member, WRN is a DNA-dependent ATPase and unwinding enzyme, but also possesses strand annealing and exonuclease activities. RecQ helicases are postulated to participate in pathways responding to replication blockage, pathways possibly initiated by fork regression. In this study, a series of model replication fork substrates were used to examine the fork regression capability of WRN. Our results demonstrate that WRN catalyzes fork regression and Holliday junction formation. This process is an ATP-dependent reaction that is particularly efficient on forks containing single-stranded gaps of at least 11-13 nt on the leading arm at the fork junction. Importantly, WRN exonuclease activity, by digesting the leading daughter strand, enhances regression of forks with smaller gaps on the leading arm, thus creating an optimal structure for regression. Our results suggest that the multiple activities of WRN cooperate to promote replication fork regression. These findings, along with the established cellular consequences of WRN deficiency, strongly support a role for WRN in regression of blocked replication forks.


Figures
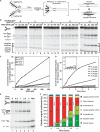
Figure 1.
Figure 1.
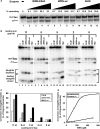
Short replication fork substrates and the influence of leading arm gap size on regression efficiency of WRN-E84A. (A) A series of model replication fork substrates with homologous parental–daughter arms of the indicated lengths was generated by a two-step annealing process (see ‘Materials and methods’ section). The parental strands (gray) were entirely complementary except for 5 nt (indicated in dark gray) precisely at the fork junctions to prevent spontaneous branch migration, while the daughter strands (black) are completely complementary except where they overlap this 5 nt region. For different short fork substrates, the length of the leading daughter strand ranged from 32 to 21 nt (denoted by dashed line) resulting in a leading arm gap of 0–11 nt at the fork junction. The putative WRN- or BLM-mediated conversion of these substrates through Holliday junction intermediates to parental and daughter duplex products is diagramed. (B) Reactions containing fork substrates (50 pM) with leading strand gaps of 0, 2, 5, 8 or 11 nt and WRN-E84A (25–150 pM) were incubated at 37°C for 5 min and analyzed by native PAGE and visualized by phosphorimaging. The migration of specific DNA markers is indicated at left, with brackets encompassing the positions of different daughter duplexes and leading daughter strands generated from different fork substrates. (C) Quantitation (presented as% conversion, in molar terms, from fork substrate) of WRN-E84A-concentration dependent formation of daughter duplex products from fork substrates with leading strand gaps from 0 to 11 nt. (D) Reactions containing WRN-E84A (200 pM) and fork substrates (50 pM) with leading strand gaps from 0 to 11 nt were incubated at 37°C for the indicated times and analyzed as in (B). Quantitation (as described earlier) of enzyme-dependent formation of daughter duplex and leading daughter strand (inset) products over time is graphed for each fork substrate. (E) Reactions containing WRN-E84A (200 pM) and fork substrate (50 pM) with an 11 nt leading arm gap (21lead fork) were incubated for the indicated times and analyzed as in (B). Lane 6 contains markers for the daughter duplex (21lead/30lag) and leading daughter strand (21lead). (F) Radioactivity associated with detectable DNA species in panel E (lanes 1–5) was quantitated and the percentage that each species contributed to the total radioactivity (100%) at each time point is plotted as a bar graph, with legend at right. The numbers between lanes correspond to the decreases in four-stranded fork substrate (top) and the sum of the increases in daughter and parental duplex species (bottom) from the previous to the subsequent time point. The near exact correspondence of these increases to the reductions in the four-stranded fork at each time point indicates that daughter and parental duplex are generated simultaneously and directly from the fork substrate.
Figure 2.
Figure 2.
Wild-type WRN (WRN-wt) catalyzes more efficient regression of fork substrates with shorter leading arm gaps than exonuclease-deficient WRN-E84A or BLM. (A) Unwinding activities of WRN-E84A (60, 120, 360, 480 pM), WRN-wt (60, 120, 360, 480 pM), or BLM (60, 120, 180, 240 pM) on partial duplex substrate (*70lag/27lag) over 5 min at 37°C were compared. Duplex and single-stranded DNA products were separated by non-denaturing PAGE and quantitated after phophorimaging, with amounts of enzyme-mediated unwinding presented above each lane. (B) Reactions containing fork substrates (50 pM) with leading strand gaps of 11 nt (lanes 1–4), 8 nt (lanes 6–9), 5 nt (lanes 11–14), 2 nt (lanes 16–19) or 0 nt (lanes 21–24) without or with BLM (160 pM), WRN-E84A (120 pM) or WRN-wt (120 pM) as indicated were incubated at 37°C for 5 min. DNA products were analyzed by native PAGE and visualized by phosphorimaging. Also subject to PAGE in parallel were marker sample mixtures (asterisks below denoting the radiolabeled strands) each containing parental duplex (*70lag/70lead) and single-stranded 70-mer (*70lag) markers but distinguished by substrate-specific daughter duplex and leading daughter strand markers as follows: *21lead/30lag and *21lead (lane 5), *24lead/30lag and *24lead (lane 10), *27lead/30lag and *27lead (lane 15), *30lead/30lag and *30lead (lane 20), and *32lead/30lag and *32lead (lane 25). (C) For the reactions analyzed in B containing various fork substrates and BLM, WRN-E84A or WRN-wt, the percentage of daughter duplex formation relative to the original (molar) amount of intact fork substrate is quantitated as described in ‘Materials and methods’ section. This data is plotted in bar graph form showing the relative efficiencies of BLM (white), WRN-E84A (gray) and WRN-wt (black) in forming daughter duplex from replication fork substrates with leading strand gaps of 11, 8, 5, 2 and 0 nt. (D) Regression reactions containing fork substrate (50 pM) with a leading strand gap of 5 nt and either WRN-wt (150, 300 or 600 pM) or WRN-E84A (25, 50, 100, 150 or 500 pM) were incubated 5 min at 37°C and analyzed as described in B. The molar amount of daughter duplex (with respect to the amount of fork substrate) generated at each WRN-wt (squares) or WRN-E84A (triangles) concentration is plotted.
Figure 3.
Figure 3.
Comparison of WRN exonuclease activity on substrates and products of fork regression reactions. WRN-wt (0, 120 or 480 pM) was incubated at 37°C for 5 min with 50 pM of fork substrate containing a leading arm gap of 5 nt [*27lead/70lead-*70lag/30lag (lanes 1–3)], pre-formed daughter duplex substrates [*21lead/30lag (lanes 4–6)], *24lead/30lag (lanes 7–9), *27lead/30lag (lanes 10–12) and *30lead/30lag (lanes 13–15)] or isolated leading daughter strand oligomers [*21lead (lanes 16–18), *24lead (lanes 19–21), *27lead (lanes 22–24) and *30lead (lanes 25–27)], with the asterisks above indicating the radiolabeled strands. The resulting DNA species were analyzed by denaturing PAGE and phosphorimaging, with the lengths (in nt) and positions of migration of the labeled, undigested oligomers within various substrates indicated at left. Importantly, WRN exonuclease activity is only detectable on the leading daughter strand in the context of the intact fork substrate.
Figure 4.
Figure 4.
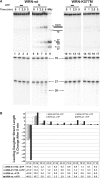
Effects of ATP on WRN regression and exonuclease activities on fork substrates. (A) Reactions containing 27lead fork substrate (50 pM) with a leading arm gap of 5 nt and either WRN-wt (150 pM, lanes 1–8) or WRN-K577M (150 pM, lanes 10–17) were incubated at 37°C in the presence or absence of ATP as indicated. Duplicate aliquots were removed from each reaction at 0, 1, 2.5 and 5 min for analysis in parallel by native (top panels) and denaturing PAGE (bottom panels). The native PAGE analysis also contained daughter duplex (27lead/30lag) and leading daughter strand (27lead) markers (lane 9) and the migration of relevant DNA structures (top) and various lengths of single-stranded species (bottom) are indicated between panels. (B) For the 0 and 5 min time points in A analyzed by denaturing PAGE, the amount of radioactivity in each band of ≤27 nt was quantitated and the percentage of each band with respect to total signal derived from the leading daughter strand was determined. Then, the relative (loss or gain) change in the percentage of each DNA species ranging between 17 and 27 nt from the 0 to the 5 min time point is presented in bar graph form to directly compare exonuclease digestion profiles under the following conditions: WRN-K577M minus ATP (white), WRN-K577M plus ATP (light gray), WRN-wt minus ATP (dark gray), WRN-wt plus ATP (black). The table at bottom shows these numerical values for the relative change in each DNA species over 5 min. Negative values associated specifically with the 27-mer reflect the reduction in the amount of intact leading daughter strand as a result of WRN exonuclease activity.
Figure 5.
Figure 5.
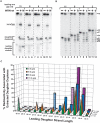
The exonuclease activity of WRN-wt performs limited digestion of the leading daughter strand of fork substrates to create an optimal structure for fork regression. Reactions containing fork substrates (50 pM) with leading strand gaps of 11, 8, 5 and 2 nt were incubated for 5 min at 37°C without (−) or with (+) WRN-wt (300 pM). (A) Aliquots of these reactions were analyzed by native PAGE along with markers (M) for undigested daughter duplexes and leading daughter strands specific for each fork substrate (lanes 3, 6, 9 and 12). Positions of migration of parental duplex (70lag/70lead), daughter duplex and leading daughter strand products are indicated at left. The letters (a–d) associated with daughter duplexes (generated from each fork substrate) identify the specific products that were excised and analyzed by denaturing PAGE. (B) In parallel, aliquots of the same reactions were subject to denaturing PAGE with the total DNA products from reactions containing WRN-wt (lanes 2, 5, 8 and 11) run alongside the corresponding daughter duplex products (a–d) individually extracted from native PAGE (lanes 3, 6, 9 and 12). The positions of migration and sizes (in nt) of both undigested leading daughter strands for each fork substrate and the primary 19 and 20 nt digestion products (denoted with arrowheads) are indicated at right. (C) The percentage of the total radioactivity associated with each band in the daughter duplex digestion profiles (B, lanes 3, 6, 9 and 12) was quantitated and then plotted with respect to the product (leading daughter strand) lengths derived from each original fork substrate [back to front, 11 nt gap (purple blocks), 8 nt gap (blue cylinders), 5 nt gap (orange pyramids) and 2 nt gap (green cones) substrates, respectively]. Striped shapes represent the amount of undigested leading daughter strand for each substrate, also signifying the maximum length possible for each corresponding substrate.
Figure 6.
Figure 6.
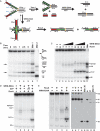
WRN regresses long fork substrate to Holliday junction structures cleaved by RusA. (A) A model replication fork substrate (top left) was constructed using four oligomers (identified in italics) in a two-step annealing process (see ‘Materials and methods’ section). Lagging and leading arms were homologous (green) proximal and heterologous (red) distal to the fork junction; unique restriction sites for Xmn I and Rsa I specified blunt end cleavage at the boundary between homologous and heterologous regions on the lagging and leading arms, respectively (blue arrows). Parental strands contained non-complementarity (5 nt, in orange) precisely at the fork junction to prevent spontaneous branch migration. Digestion with Xmn I and Rsa I generated a replication fork with shorter, homologous arms that, upon fork regression (by WRN-E84A) would yield daughter and parental duplex products (top pathway). In contrast, potential WRN-E84A-mediated regression of the unrestricted fork would yield a Holliday junction structure (bottom left) in which branch migration would be limited by the heterologous regions. Since both the labeled and unlabeled strands within the homologous region of each arm contain consensus 5′-CC-3′ sequences for RusA cleavage (sequences indicated in yellow and white while cleavage sites denoted by solid and dotted arrows, respectively), putative Holliday junctions may be resolved by RusA to yield two nicked duplexes (bottom right). Although resolution by RusA may occur on the labeled or unlabeled strands of the Holliday junction, only products generated by cleavage of the labeled strands are depicted. (B) Rsa I- and Xmn I-restricted long fork substrate (50 pM) was incubated at 37°C for the indicated times with WRN-E84A (100 pM). DNA products were analyzed by native PAGE with phosphorimaging, along with heat-denatured fork preparations either slow-cooled to produce various annealing products (Mkr 1) or rapidly cooled to maintain oligomers in single-stranded form (Mkr 2). Migration of relevant DNA structures is denoted at right. (C) Reactions containing unrestricted long fork substrate (50 pM) without or with WRN-E84A (100, 200, 400 or 600 pM) were initiated at 37°C, supplemented with RusA (10 nM) after 1 min as indicated, and stopped after 5 min total. DNA products were analyzed as in B, along with a marker (lane 11) containing labeled 82lag/122lag, 122lead, 82lag and a 77 bp duplex. (D) Reactions containing unrestricted long fork (50 pM) and WRN-E84A (200 pM) and RusA (10 nM) where indicated were performed without (−) or with (+) ATP (1 mM) or ATPγS (1 mM, denoted γS) and analyzed as in C, with the position of specific markers at right. (E) Reactions containing unrestricted long fork substrate (200 pM), WRN-E84A (800 pM) and ATP were incubated at 37°C for 15 min total with RusA (40 nM) added at 1 min where indicated. Aliquots were analyzed in parallel by native (left panel, lanes 1–4) and denaturing PAGE (right panel, lanes 5–8). For native PAGE, the bands denoted a and b represent DNA species that were excised, extracted and analyzed subsequently by denaturing PAGE (right panel, lanes 10 and 11, respectively). Also run on this gel were labeled 30-mer (lane 9) and 70-mer (lane 12) as markers for RusA cleavage at its specific sites on the labeled 82lag and 122lead strands, respectively, of putative Holliday junction structures formed from unrestricted long fork substrate.

Similar articles

Cited by

References

    1. Goto M. Hierarchical deterioration of body systems in Werner's syndrome: implications for normal ageing. Mech. Ageing Dev. 1997;98:239–254. - PubMed
    1. Martin GM, Oshima J. Lessons from human progeroid syndromes. Nature. 2000;408:263–266. - PubMed
    1. Yu CE, Oshima J, Fu YH, Wijsman EM, Hisama F, Alisch R, Matthews S, Nakura J, Miki T, et al. Positional cloning of the Werner's syndrome gene. Science. 1996;272:258–262. - PubMed
    1. Ellis NA, Groden J, Ye TZ, Straughen J, Lennon DJ, Ciocci S, Proytcheva M, German J. The Bloom's syndrome gene product is homologous to RecQ helicases. Cell. 1995;83:655–666. - PubMed
    1. Kitao S, Shimamoto A, Goto M, Miller RW, Smithson WA, Lindor NM, Furuichi Y. Mutations in RECQL4 cause a subset of cases of Rothmund-Thomson syndrome. Nat. Genet. 1999;22:82–84. - PubMed

Publication types