

Evaluation of pH during cytostomal endocytosis and vacuolar catabolism of haemoglobin in Plasmodium falciparum
- PMID: 17696875
- PMCID: PMC2275073
- DOI: 10.1042/BJ20070934
Evaluation of pH during cytostomal endocytosis and vacuolar catabolism of haemoglobin in Plasmodium falciparum
Abstract
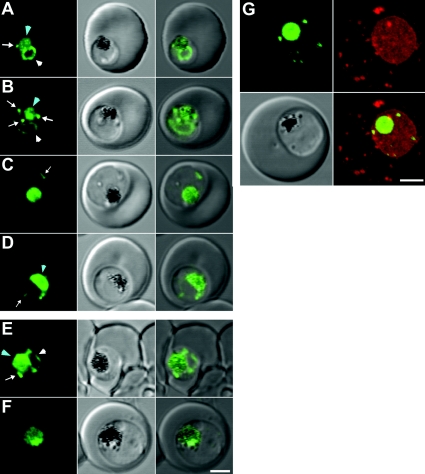
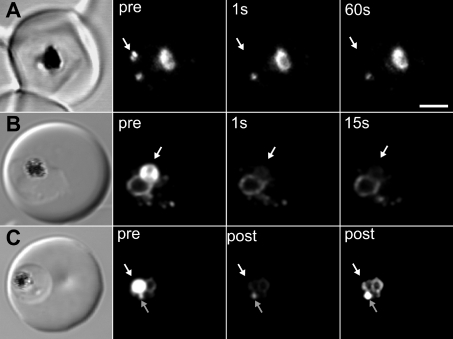
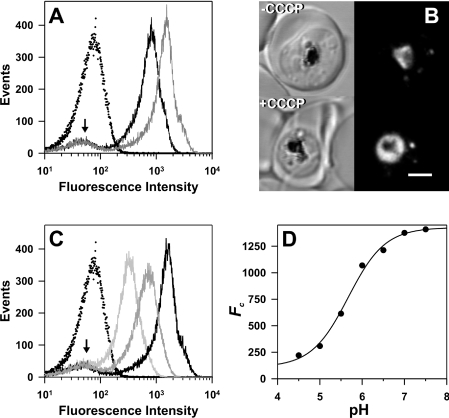
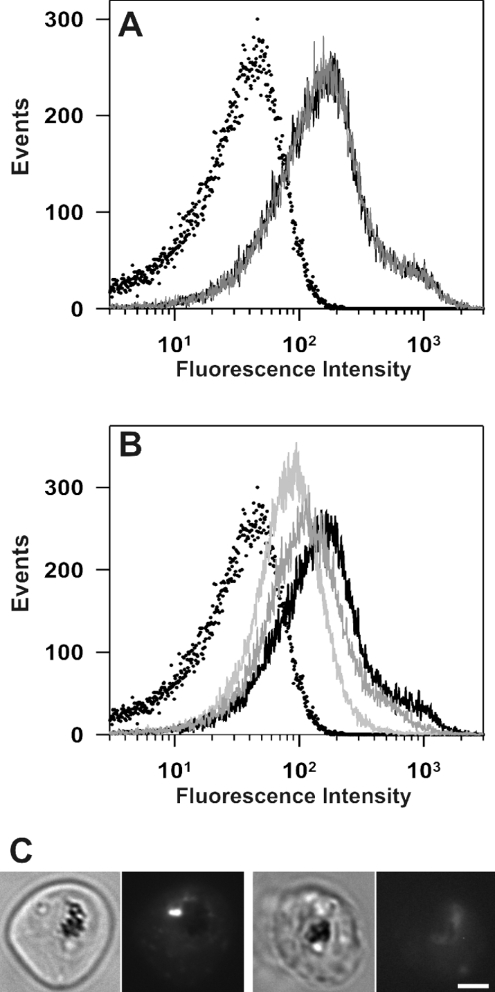
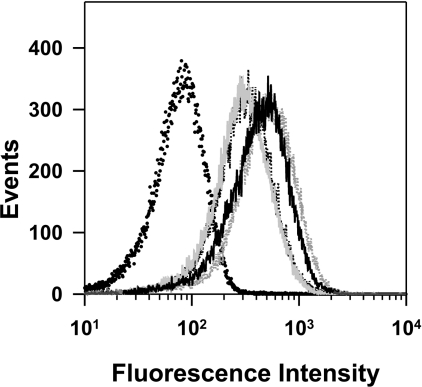
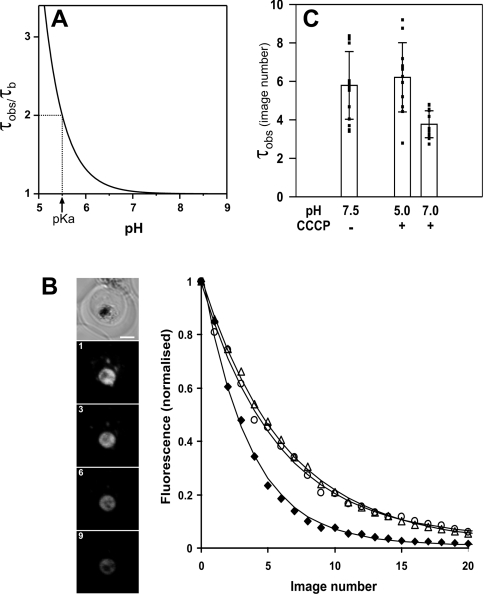
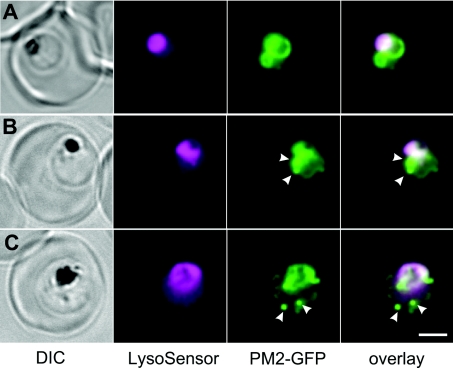
The DV (digestive vacuole) of the malaria parasite, Plasmodium falciparum, is the site of Hb (haemoglobin) digestion and haem detoxification and, as a consequence, the site of action of CQ (chloroquine) and related antimalarials. However, the precise pH of the DV and the endocytic vesicles that feed it has proved difficult to ascertain. We have developed new methods using EGFP [enhanced GFP (green fluorescent protein)] to measure the pH of intracellular compartments. We have generated a series of transfectants in CQ-sensitive and -resistant parasite strains expressing GFP chimaeras of the DV haemoglobinase, plasmepsin II. Using a quantitative flow cytometric assay, the DV pH was determined to be 5.4-5.5. No differences were detected between CQ-sensitive and -resistant strains. We have also developed a method that relies on the pH dependence of GFP photobleaching kinetics to estimate the pH of the DV compartment. This method gives a pH estimate consistent with the intensity-based measurement. Accumulation of the pH-sensitive probe, LysoSensor Blue, in the DV confirms the acidity of this compartment and shows that the cytostomal vesicles are not measurably acidic, indicating that they are unlikely to be the site of Hb digestion or the site of CQ accumulation. We show that a GFP probe located outside the DV reports a pH value close to neutral. The transfectants and methods that we have developed represent useful tools for investigating the pH of GFP-containing compartments and should be of general use in other systems.
Figures
Similar articles
-
Quantitative pH measurements in Plasmodium falciparum-infected erythrocytes using pHluorin.Cell Microbiol. 2007 Apr;9(4):1004-13. doi: 10.1111/j.1462-5822.2006.00847.x. Cell Microbiol. 2007. PMID: 17381432
-
Measuring pH of the Plasmodium falciparum digestive vacuole by flow cytometry.Trop Biomed. 2015 Sep;32(3):485-93. Trop Biomed. 2015. PMID: 26695209
-
Digestive-vacuole genesis and endocytic processes in the early intraerythrocytic stages of Plasmodium falciparum.J Cell Sci. 2010 Feb 1;123(Pt 3):441-50. doi: 10.1242/jcs.061499. Epub 2010 Jan 12. J Cell Sci. 2010. PMID: 20067995
-
The pH of the Plasmodium falciparum digestive vacuole: holy grail or dead-end trail?Trends Parasitol. 2002 Oct;18(10):441-4. doi: 10.1016/s1471-4922(02)02365-6. Trends Parasitol. 2002. PMID: 12377594 Review.
-
Is PfCRT a channel or a carrier? Two competing models explaining chloroquine resistance in Plasmodium falciparum.Trends Parasitol. 2007 Jul;23(7):332-9. doi: 10.1016/j.pt.2007.04.013. Epub 2007 May 10. Trends Parasitol. 2007. PMID: 17493873 Review.
Cited by
-
Know your enemy: understanding the role of PfCRT in drug resistance could lead to new antimalarial tactics.Cell Mol Life Sci. 2012 Jun;69(12):1967-95. doi: 10.1007/s00018-011-0906-0. Cell Mol Life Sci. 2012. PMID: 22286067 Free PMC article. Review.
-
Increase on the initial soluble heme levels in acidic conditions is an important mechanism for spontaneous heme crystallization in vitro.PLoS One. 2010 Sep 13;5(9):e12694. doi: 10.1371/journal.pone.0012694. PLoS One. 2010. PMID: 20856937 Free PMC article.
-
Chloroquine transport in Plasmodium falciparum. 2. Analysis of PfCRT-mediated drug transport using proteoliposomes and a fluorescent chloroquine probe.Biochemistry. 2009 Oct 13;48(40):9482-91. doi: 10.1021/bi901035j. Biochemistry. 2009. PMID: 19725576 Free PMC article.
-
Analysis of chloroquine resistance transporter (CRT) isoforms and orthologues in S. cerevisiae yeast.Biochemistry. 2011 Aug 9;50(31):6701-10. doi: 10.1021/bi200922g. Epub 2011 Jul 19. Biochemistry. 2011. PMID: 21744797 Free PMC article.
-
Biochemical and cellular characterisation of the Plasmodium falciparum M1 alanyl aminopeptidase (PfM1AAP) and M17 leucyl aminopeptidase (PfM17LAP).Sci Rep. 2021 Feb 3;11(1):2854. doi: 10.1038/s41598-021-82499-4. Sci Rep. 2021. PMID: 33536500 Free PMC article.
References
-
- Hellerstein S., Spees W., Surapathana L. O. Hemoglobin concentration and erythrocyte cation content. J. Lab. Clin. Med. 1970;76:10–24. - PubMed
-
- Lew V. L., Tiffert T., Ginsburg H. Excess hemoglobin digestion and the osmotic stability of Plasmodium falciparum-infected red blood cells. Blood. 2003;101:4189–4194. - PubMed
-
- Rosenthal P. J., Meshnick S. R. Hemoglobin catabolism and iron utilization by malaria parasites. Mol. Biochem. Parasitol. 1996;83:131–139. - PubMed
-
- Francis S. E., Sullivan D. J., Jr, Goldberg D. E. Hemoglobin metabolism in the malaria parasite Plasmodium falciparum. Annu. Rev. Microbiol. 1997;51:97–123. - PubMed
Publication types
MeSH terms
Substances
Grants and funding
LinkOut - more resources
Full Text Sources
Other Literature Sources