. 2007 Nov 15;408(1):7-18.
doi: 10.1042/BJ20070058.

Targeting of FAK Ser910 by ERK5 and PP1delta in non-stimulated and phorbol ester-stimulated cells

Affiliations

Targeting of FAK Ser910 by ERK5 and PP1delta in non-stimulated and phorbol ester-stimulated cells

Emma Villa-Moruzzi. Biochem J. .

Abstract

Ser910 of FAK (focal adhesion kinase) was phosphorylated in fibroblasts treated with the phorbol ester PMA and dephosphorylated by PP1d (protein phosphatase 1d), as indicated by shRNA (small-hairpin RNA) gene silencing. Ser910 of FAK was reported previously to be an ERK (extracellular-signal-regulated kinase) 1/2 target in cells treated with phorbol esters. In contrast, various approaches, including the use of the MEK (mitogen-activated protein kinase/ERK kinase) inhibitors UO126 and CI-1040 to inhibit ERK1/2 pointed to the involvement of ERK5. This hypothesis was confirmed by: (i) shRNA ERK5 gene silencing, which resulted in complete pSer910 loss in non-stimulated and PMA-stimulated cells; (ii) direct phosphorylation of recombinant FAK by ERK5; and (iii) ERK5 activation by PMA. PMA stimulation and ERK5 silencing in MDA-MB 231 and MDA-MB 361 breast cancer cells indicated Ser910 targeting by ERK5 also in these cells. Given the proximity of Ser910 to the FAT (focal adhesion targeting) regulatory domain of FAK, cell proliferation and morphology were investigated in FAK-/- cells expressing S910A mutant FAK. The cell growth rate decreased and exposure to PMA induced peculiar morphological changes in cells expressing S910A, with respect to wild-type FAK, suggesting a role for Ser910 in these processes. The present study indicates, for the first time, the phosphorylation of Ser910 of FAK by ERK5 and its dephosphorylation by PP1d, and suggested a role for Ser910 in the control of cell shape and proliferation.


Figures
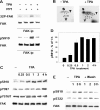
Figure 1
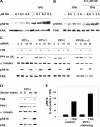
Figure 1. FAK phosphorylation and dephosphorylation in cells treated with PMA
(A) Metabolic labelling of FAK and phosphorylation of Ser910. FAK was immunoprecipitated from fibroblasts that had been metabolically labelled with [32P]phosphoric acid and treated (+TPA) or not (−TPA) with 300 nM PMA for 4 h. The immunocomplexes were prepared in duplicate, and one complex from each treatment was incubated further with 2 units of muscle PP1 at 30 °C for 20 min (+PP1). Following SDS/8.5% PAGE and transblotting on to Immobilon-P, the membrane was first exposed to detect the radioactivity ([32P]FAK), then probed to detect FAK. In a similar experiment, but without metabolic labelling, FAK was immunoprecipitated (ip), treated with PP1 as above, and used to detect pSer910 of FAK (pS910) and FAK. (B) Phospho-amino acid analysis of labelled FAK. Two anti-FAK immunoprecipitates were prepared from [32P]phosphoric acid-labelled cells treated (+TPA) or not (−TPA) with PMA, as in (A). The FAK protein band was cut from the Immobilon-P membrane, hydrolysed at 110 °C for 1 h, analysed by two-dimensional high-voltage electrophoresis and exposed to detect the radioactivity. Residues are indicated using the single-letter amino acid code. (C) FAK phosphorylation at Ser910, Tyr397 and Tyr576/577. Cells were treated with 300 nM PMA (TPA) and collected at the indicated time points, and cell lysates were analysed by electrophoresis and immunoblotting, to detect pSer910 (pS910), FAK phosphorylation at Tyr397 (pY397) and Tyr576/577 (pY576/7), and FAK. (D) Quantification of the changes in Ser910 phosphorylation. The pSer910 bands from cells as in (C) were quantified by densitometric scanning and the data were normalized by adopting the 1 h value as 100%. Results are means±S.E.M. for four independent experiments. (E) FAK phosphorylation at Ser910 and Ser722 following PMA (TPA) treatment and subsequent PMA removal. PMA-treated cells as in (A) were either collected at 1 and 3 h, or washed twice at 3 h and incubated further for up to 3 h in the absence of PMA. Lysates from cells collected at the indicated time points were analysed to detect pSer722 of FAK (pS722), pSer910 (pS910) and FAK.
Figure 2
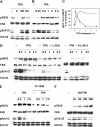
Figure 2. Phosphatase targeting of pSer910 of FAK
(A) Phosphorylation of Ser910 in cells treated with PMA (TPA) and exposed further to increasing concentrations of okadaic acid (OA). Cells were incubated with or without 300 nM PMA for 40 min and with the indicated okadaic acid concentrations for an additional 40 min. Cells were collected, and lysates were analysed to detect pSer910 (pS910) and FAK. (B) Phosphorylation of Ser910 in cells treated with okadaic acid (OA) and exposed further to PMA (TPA). Cells were incubated with or without 0.4 μM okadaic acid for 20 min, subsequently with 300 nM PMA for up to 2 h and collected at the indicated time points. (C) Effect of transient silencing of PP1α, PP1γ1, PP1δ or PP2A (α+β) and of PMA (TPA) on pSer910. Rat fibroblasts were transfected with siRNA targeting the indicated PP1 or PP2A isoforms (si) or control siRNA (c) at zero time, day 1 and day 2, and collected at day 3, as described further in the Materials and methods section. PMA treatment (300 nM) before collecting cells was for 1 h. siRNA targeting PP2Aα and PP2Aβ were co-transfected. Following Western blotting, the membranes were probed to detect the PP1 or PP2A isoforms, α-tubulin, pSer910 (pS910) and FAK. Blots are representative of three independent experiments. (D) Effect of stable silencing (silenc.) of PP1δ and of PMA (TPA) on pSer910. NIH 3T3 fibroblasts were transfected with either shRNA vector targeting PP1δ (sh) or control empty vector (0), and stable transfectants were prepared by puromycin selection. Cell exposure to PMA and other reagents was as in (C). (E) Quantification of the effect of PMA on pSer910 in cells carrying stable PP1δ silencing. The pSer910 (pS910) bands from cells as in (D) were quantified by densitometric scanning, and the data obtained were normalized by adopting the control+PMA (TPA) value as 100%. Results are means±S.E.M. for four independent experiments, using two different siRNA constructs.
Figure 3
Figure 3. Phosphorylation of FAK Ser910 and ERK1/2 activity in cells treated with PMA (TPA) and with kinase inhibitors
(A) Treatment with kinase inhibitors. Cells were treated with 300 nM PMA for 1 h in the presence of the following kinase inhibitors: 10 μM U0126, to inhibit MEK1/2 (U); 10 μM SB203580, to inhibit p38 (SB) and 100 μM roscovitine, to inhibit CDKs (Ro). In addition to pSer910 (pS910) and FAK, the activation level of ERK1/2 (pERK1/2) and ERK1/2 protein were detected on cell lysates. (B) Time course of PMA treatment. Cells were treated with PMA for up to 4 h and analysed as in (A). (C) Quantification of the time course of PMA treatment. The pSer910 and pERK1/2 bands from blots as in (B) were quantified by densitometric scanning, and the data were normalized by adopting the maximal value obtained for each phosphoprotein as 100%. Results are means±S.E.M. for four independent experiments. (D) Treatment with U0126. Cells were treated with 300 nM PMA (TPA) in the presence or not of 1 or 10 μM U0126 (U). (E) Treatment with CI-1040. Cells were treated with 300 nM PMA in the presence or not of 1 μM of the MEK1/2 inhibitor CI-1040. (F) Treatment with increasing PMA concentrations. Cells were treated with the indicated PMA (TPA) concentrations for 1 h.
Figure 4
Figure 4. Involvement of ERK5 in the phosphorylation of FAK Ser910
(A) Transient silencing (silenc.) of ERK5. NIH 3T3 cells were co-transfected with either empty vector (0) or the ERK5 shRNA vector (sh) together with a vector that expresses the puromycin resistance gene. At 24 h after transfection, the cells were exposed to 10 μg/ml puromycin, to kill non-transfected cells, and collected at 72 h. Cell lysates were used to detect ERK5, pSer910 (pS910), FAK, GFP (encoded by the transfected vectors) and α-tubulin. (B, C) PMA (TPA) treatment of cells carrying stable ERK5 silencing. Stable transfectants, obtained from cells transfected as in (A), were treated or not with 300 nM PMA for 1 h and analysed as in (A) (B) or for ERK1/2 activation (pERK1/2) and ERK1/2 protein (C). (D) Phosphorylation of Ser910 of FRNK by ERK5. GST–FRNK, either wild-type or S910A mutant, was bound to glutathione–Sepharose beads and incubated with immunoprecipitated ERK5 (obtained from fibroblasts exposed to 300 nM PMA for 1 h) in the presence of [γ-32P]ATP/MgCl2. This was followed by electrophoresis, Coomassie Blue staining and exposure to detect the radioactivity incorporated into FRNK (32P-FRNK). Wild-type and S910A-FRNK were detected also as GST-fusion proteins in the bacterial lysate used for the pull-down. (E) Quantification of [32P]FRNK (32P-FRNK). FRNK bands were excised from the gel (see D) and counted (c.p.m./FRNK band). Results are means±S.E.M. for three independent experiments. WT, wild-type.
Figure 5
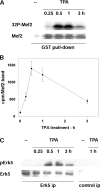
Figure 5. Activation of ERK5 in cells treated with PMA (TPA)
(A, B) ERK5 activity assayed as Mef2 kinase. (A) GST–Mef2 was bound to glutathione–Sepharose beads and incubated with [γ-32P]ATP/MgCl2 and cell extract from rat fibroblasts exposed to 300 nM PMA for the indicated time. This was followed by electrophoresis, Coomassie Blue staining (Mef2) and exposure to detect the radioactivity incorporated into Mef2 (32P-Mef2). (B) Quantification of 32P-Mef2. Mef2 bands were excised from the gel (see A) and counted (c.p.m./Mef2 band). Results are means±S.E.M. for three independent experiments. (C) ERK5 activity assayed as pERK5. ERK5 was immunoprecipitated (ERK5 ip), followed by electrophoresis, probing with antibodies that recognize the phosphorylation of Thr218 and Tyr220 of ERK5 (pERK5) and membrane staining with Coomassie Blue (ERK5). Control immunoprecipitates (control ip) are also shown.
Figure 6
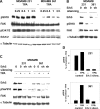
Figure 6. Role of PMA and ERK5 in the phosphorylation of FAK Ser910 in MDA-MB 231 and MDA-MB 361 cells
(A) Phosphorylation of Ser910 and ERK1/2 activity in cells treated with PMA (TPA). Cells were treated with 300 nM PMA and collected at the indicated time points. Lysate analysis was as in Figure 4. (B) Phosphorylation of Ser910 following ERK5 silencing. Stable ERK5 silencing was obtained from cells transfected with either the empty vector (0) or the ERK5 shRNA vector (sh). (C) Phosphorylation of Ser910 following PMA (TPA) treatment of cells carrying silenced ERK5. Cells were treated with 300 nM PMA for 1 h and analysed as in (B). (D) Quantification of the effect of PMA on pSer910 (pS910) in cells carrying ERK5 silencing (silenc.). The pSer910 bands from cells in (C) were quantified by densitometric scanning and the data obtained were normalized by adopting the control+PMA value as 100%. Results are means±S.E.M. for four independent experiments, using two different siRNA constructs.
Figure 7
Figure 7. Activation of ERK5 in MDA-MB 231 and MDA-MB 361 cells treated with PMA (TPA)
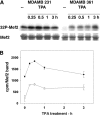
ERK5 activity was assayed as Mef2 kinase. (A) Cells were treated and analysed as in Figure 5(A). (B) Quantification of 32P-labelled Mef2 (32P-Mef2). Mef2 bands were excised from the gel (see A) and counted (c.p.m./Mef2 band). Results are means±S.E.M. for three independent experiments.
Figure 8
Figure 8. Effects of the expression of S910A FAK and PMA treatment in FAK−/− cells
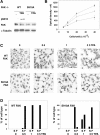
(A) Phosphorylation of Ser910 in cells treated with PMA (TPA). Cells were treated with 300 nM PMA for 1 h and cell lysates were analysed for pSer910 (pS910), FAK and α-tubulin. (B) Proliferation of cells expressing wild-type or S910A mutant FAK. The indicated amounts of FAK−/− cells expressing wild-type (○) or S910A FAK (▼) or control FAK−/− cells (●), were seeded in 24-well Costar plates, grown for 48 h, fixed, stained with Crystal Violet and analysed spectrophotometrically. Results are means±S.E.M. for five experiments, using two different clones for each cell type (three experiments in the case of FAK−/− cells). (C) Morphological changes in cells treated with PMA (TPA). Cells treated with PMA as in (A) were fixed at the indicated time points and stained with Giemsa stain. The images shown are representative of several experiments performed. (D) Quantification of the morphological changes in cells treated with PMA (TPA). Equivalent fields, displaying cells treated as in (C) (approx. 20–25 cells/field), were analysed for the presence of cells with retracted cytoplasm and long thin extensions (defined as star-like cells, S) and cells with fibroblast shape (defined as fibroblast-like, F). Results are percentages of S and F cells counted in each field and are means±S.E.M. for ten fields from three independent experiments. WT, wild-type.

Similar articles

Cited by

References

    1. Hanks S. K., Ryzhova L., Shin N., Brabek J. Focal adhesion kinase signaling activities and their implications in the control of cell survival and motility. Front. Biosci. 2003;8:d982–d986. - PubMed
    1. Parsons J. T. Focal adhesion kinase: the first ten years. J. Cell Sci. 2003;116:1409–1416. - PubMed
    1. Carragher N. O., Frame M. C. Focal adhesion and actin dynamics: a place where kinases and proteases meet to promote invasion. Trends Cell Biol. 2004;14:241–249. - PubMed
    1. Owen J. D., Ruest P. J., Fry D. W., Hanks S. K. Induced focal adhesion kinase (FAK) expression in FAK-null cells enhances cell spreading and migration requiring both auto- and activation loop phosphorylation sites and inhibits adhesion-dependent tyrosine phosphorylation of Pyk2. Mol. Cell. Biol. 1999;19:4806–4818. - PMC - PubMed
    1. Schlaepfer D. D., Mitra S. K., Ilic D. Control of motile and invasive phenotypes by focal adhesion kinase. Biochim. Biophys. Acta. 2004;1692:77–102. - PubMed

Publication types

MeSH terms

Substances

LinkOut - more resources