Comparative Study
. 2007 Jul 31:8:50.
doi: 10.1186/1471-2350-8-50.

Lack of increases in methylation at three CpG-rich genomic loci in non-mitotic adult tissues during aging

Affiliations
Comparative Study

Lack of increases in methylation at three CpG-rich genomic loci in non-mitotic adult tissues during aging

Michelle W Chu et al. BMC Med Genet. .

Abstract

Background: Cell division occurs during normal human development and aging. Despite the likely importance of cell division to human pathology, it has been difficult to infer somatic cell mitotic ages (total numbers of divisions since the zygote) because direct counting of lifetime numbers of divisions is currently impractical. Here we attempt to infer relative mitotic ages with a molecular clock hypothesis. Somatic genomes may record their mitotic ages because greater numbers of replication errors should accumulate after greater numbers of divisions. Mitotic ages will vary between cell types if they divide at different times and rates.

Methods: Age-related increases in DNA methylation at specific CpG sites (termed "epigenetic molecular clocks") have been previously observed in mitotic human epithelium like the intestines and endometrium. These CpG rich sequences or "tags" start unmethylated and potentially changes in methylation during development and aging represent replication errors. To help distinguish between mitotic versus time-associated changes, DNA methylation tag patterns at 8-20 CpGs within three different genes, two on autosomes and one on the X-chromosome were measured by bisulfite sequencing from heart, brain, kidney and liver of autopsies from 21 individuals of different ages.

Results: Levels of DNA methylation were significantly greater in adult compared to fetal or newborn tissues for two of the three examined tags. Consistent with the relative absence of cell division in these adult tissues, there were no significant increases in tag methylation after infancy.

Conclusion: Many somatic methylation changes at certain CpG rich regions or tags appear to represent replication errors because this methylation increases with chronological age in mitotic epithelium but not in non-mitotic organs. Tag methylation accumulates differently in different tissues, consistent with their expected genealogies and mitotic ages. Although further studies are necessary, these results suggest numbers of divisions and ancestry are at least partially recorded by epigenetic replication errors within somatic cell genomes.


Figures

Figure 1
Figure 1
A human somatic cell tree. A: Every cell has a genealogy that starts with the zygote and ends with its present day phenotype. The genealogy of a differentiated cell can be divided into three phenotypic phases – development from the zygote, a stem cell phase, and differentiation. B: Stem cells are common ancestors in a somatic cell tree. The zygote is the ultimate common ancestor, and adult stem cells are more recent common ancestors of differentiated cells. C: Replication errors record cell division or genome duplication. Illustrated are a 5' to 3' series of eight CpG sites that are initially unmethylated (open circles). Random replication errors may accumulate during cell division such that some CpG sites become methylated (filled circles). The greater the numbers of divisions since the zygote (mitotic age), the greater the number of errors or methylation (molecular clock hypothesis).
Figure 2
Figure 2
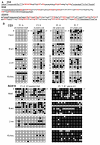
Epigenetic molecular clocks or tags. A: Sequences (after bisulfite conversion) of the CSX (8 CpG sites), BGN (9 CpG sites), and SOX10 (20 CpG sites) tags. Primer sites are underlined, CpG sites are in bold, and a bisulfite converted "C" at a non-CpG site is indicated by "T". B: Examples of CSX and SOX10 tags sampled from the heart, brain, liver or kidney of different aged individuals. The tags are arranged in a 5' to 3' horizontal order with methylated sites indicated by filled circles. There are eight alleles per tissue. Patient H did not have a liver specimen and the liver is instead from Patient G, a 31 year old.
Figure 3
Figure 3
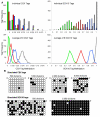
Simulations of random methylation errors at the CSX and SOX10 tags. For CSX tags, the simulated error rates are 1 × 10⁻⁴ per CpG site per division for methylation and 2 × 10⁻⁵ for demethylation. SOX10 tags appear to become methylated faster in human tissues, and the simulated error rate for methylation is greater (1 × 10⁻³) with the same demethylation error rate as CSX. Errors are assumed to be independent between CpG sites, and each tag is an independent genome (no shared ancestry). These simulations are presented to illustrate the general stochastic nature of mutation, and are not an attempt to model the experimental data. A: Frequencies of individual tag methylation values and averages of 8 tags after 500 (green), 1,000 (red), 2,000 (blue), or 5,000 (gray) simulated divisions. As expected, values are more scattered for individual versus average tag values. B: Examples of simulated individual CSX or SOX10 tags after different numbers of divisions.
Figure 4
Figure 4
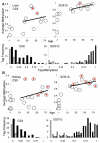
Heart tag methylation. A: Tag methylation with chronological aging. Circles are averages of eight tags with red solid dots from the right heart, and blue X's from the left heart. Trend lines (black, all values; red, right heart; blue, left heart) were not significantly different from a level line (linear regression, p values > 0.05). B: Histograms of individual tags comparing individuals before heart growth is largely finished (≤ 5 years of age, gray bars, N = 64, 63, and 37 alleles for CSX, SOX10, and BGN tags) and adults (black bars, N = 161, 143, and 94 alleles for CSX, SOX10, and BGN tags). CSX or SOX10 tag methylation values were significantly higher in adults.
Figure 5
Figure 5
Brain tag methylation. A: Tag methylation with chronological aging. Circles are averages of eight tags with red dots from the cerebellum and blue X's from the cerebral cortex. Trend lines (black, all values; red, cerebellum; blue, cortex) were not significant different from a level line (linear regression, p values > 0.05). B: Histograms of individual tags comparing individuals before brain development is largely finished (< 2 years of age, gray bars, N = 72, 72, and 56 alleles for CSX, SOX10, and BGN tags) and older individuals > 2 years of age (black bars, N = 144, 144, and 88 alleles for CSX, SOX10, and BGN tags). CSX or SOX10 tag methylation values were significantly higher in older individuals. C: Histograms of individual tags comparing methylation between the cerebellum (gray bars, N = 40, 40, and 24 alleles for CSX, SOX10, and BGN tags) and the cortex (black bars, N = 104, 104, and 64 alleles for CSX, SOX10, and BGN tags) from older individuals (> 2 years of age). CSX and SOX10 tags were significantly more methylated in the cerebellum. Note that there is a high frequency of completely unmethylated SOX10 tags in the older cortex, which may reflect the presence of neural cells that express SOX10 and therefore preclude methylation (see Discussion).
Figure 6
Figure 6
Liver and kidney methylation. A: Tag methylation with chronological aging in the liver. The trend line indicates an age-related increase in methylation, but the data were not significantly different from a level line (p = 0.38 for CSX, p = 0.19 for SOX10, linear regression). Red solid dots indicate the two samples with cirrhosis. Tag methylation was significantly greater in adults (black bars, N = 80 and 72 alleles for CSX and SOX10 tags) compared to younger individuals ≤ 5 years of age (gray bars, N = 32 alleles for CSX and SOX10 tags). B: Tag methylation with chronological aging in the kidney. The trend line indicates an age-related increase in methylation, but the data were not significantly different from a level line (p = 0.59 for CSX, p = 0.097 for SOX10). Red solid dots indicate samples with benign nephrosclerosis. Tag methylation was significantly greater in adults (black bars, N = 105 and 104 alleles for CSX and SOX10 tags) compared to younger individuals ≤ 5 years of age (gray bars, N = 40 alleles for CSX and SOX10 tags).
Figure 7
Figure 7
Average tag methylation with chronological age for multiple human tissues. A: Trend lines for brain (blue), heart (red), liver (brown), and kidney (purple). Negative ages represent fetal tissues (birth equal zero years). B: Trend lines for colon (black, data from ref. 11 and additional unpublished specimens), small intestines (black dotted, data from ref. 12), endometrium (gray dotted, data from ref. 13), and hair follicles (gray, data from ref. 19). SOX10 tag values for intestines and endometrium are unpublished data from three different aged individuals (six glands and 48 tags from each organ).
Figure 8
Figure 8
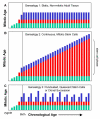
Types of observed human somatic cell genealogies. A: Static genealogy observed in adult non-mitotic tissues (heart, brain, kidney, liver). Genealogical phases are indicated by green (development from the zygote to the tissue stem cell), red (stem cell phase), and blue (differentiation). Adult genealogies and mitotic ages are fixed with respect to chronological age and replication errors in present day cells accumulated much earlier in life. B: Continuous genealogy observed in mitotic epithelium. Only the stem cell phase can vary with chronological age because numbers of divisions are relatively constant during development and differentiation. The mitotic age of a differentiated cell is the mitotic age of its stem cell plus the few additional divisions required for differentiation. An age-related increase in replication errors and mitotic age depends on stem cell divisions. C: Punctuated genealogy observed in hair follicles. Average mitotic age and replication errors do not increase with age despite the high hair follicle mitotic activity because hairs and their follicles are cyclically lost and destroyed every few years. Bulge stem cells initiate each new hair cycle, and the mitotic age of a differentiated follicle cell is the age of the stem cell that initiates the new cycle plus the divisions in the follicle. New hairs would have essentially the same mitotic age regardless of chronological age because bulge stem cells are relatively quiescent and only divide a few times at the start of each new hair cycle [26], or if there is clonal succession [25] in which new hair cycles are initiated by previously latent stem cells.

Similar articles

Cited by

References

    1. Bromham L, Penny D. The modern molecular clock. Nat Rev Genet. 2003;4:216–224. doi: 10.1038/nrg1020. - DOI - PubMed
    1. Woese C. The universal ancestor. Proc Natl Acad Sci USA. 1998;95:6854–6859. doi: 10.1073/pnas.95.12.6854. - DOI - PMC - PubMed
    1. Wang TL, Rago C, Silliman N, Ptak J, Markowitz S, Willson JK, Parmigiani G, Kinzler KW, Vogelstein B, Velculescu VE. Prevalence of somatic alterations in the colorectal cancer cell genome. Proc Natl Acad Sci USA. 2002;99:3076–3080. doi: 10.1073/pnas.261714699. - DOI - PMC - PubMed
    1. Salipante SJ, Horwitz MS. Phylogenetic fate mapping. Proc Natl Acad Sci USA. 2006;103:5448–5453. doi: 10.1073/pnas.0601265103. - DOI - PMC - PubMed
    1. Frumkin D, Wasserstrom A, Kaplan S, Feige U, Shapiro E. Genomic variability within an organism exposes its cell lineage tree. PLoS Comput Biol. 2005;1:e50. doi: 10.1371/journal.pcbi.0010050. - DOI - PMC - PubMed

Publication types