. 2007 Sep-Oct;1769(9-10):546-58.
doi: 10.1016/j.bbaexp.2007.06.004. Epub 2007 Jul 6.

Transcriptional and epigenetic regulation of the integrin collagen receptor locus ITGA1-PELO-ITGA2

Affiliations

Transcriptional and epigenetic regulation of the integrin collagen receptor locus ITGA1-PELO-ITGA2

Yann Cheli et al. Biochim Biophys Acta. 2007 Sep-Oct.

Abstract

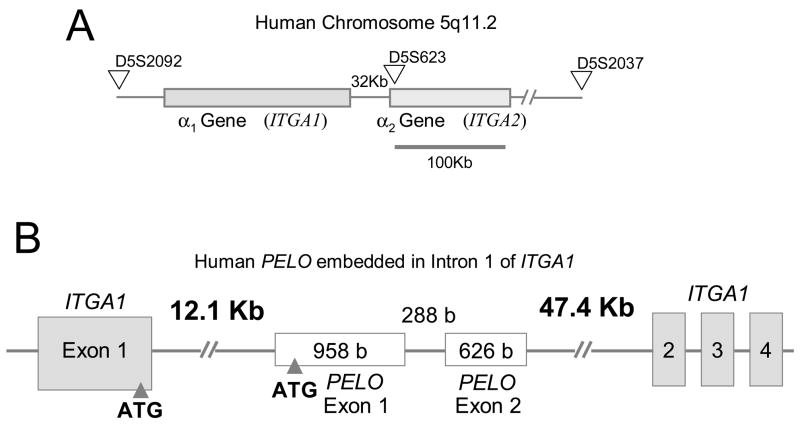
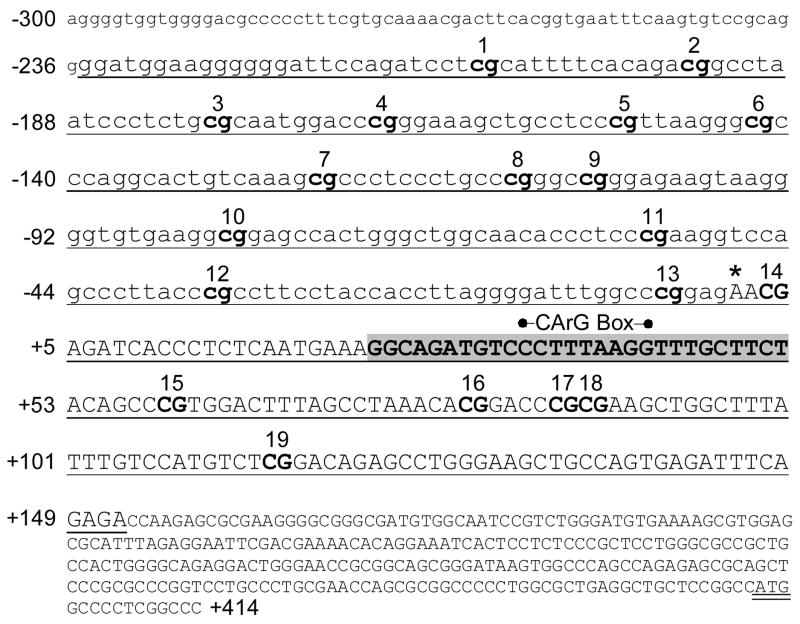
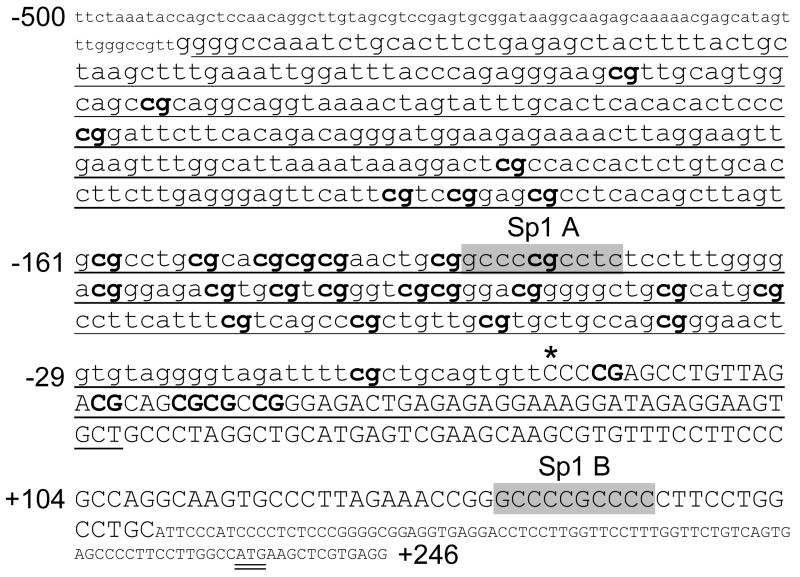
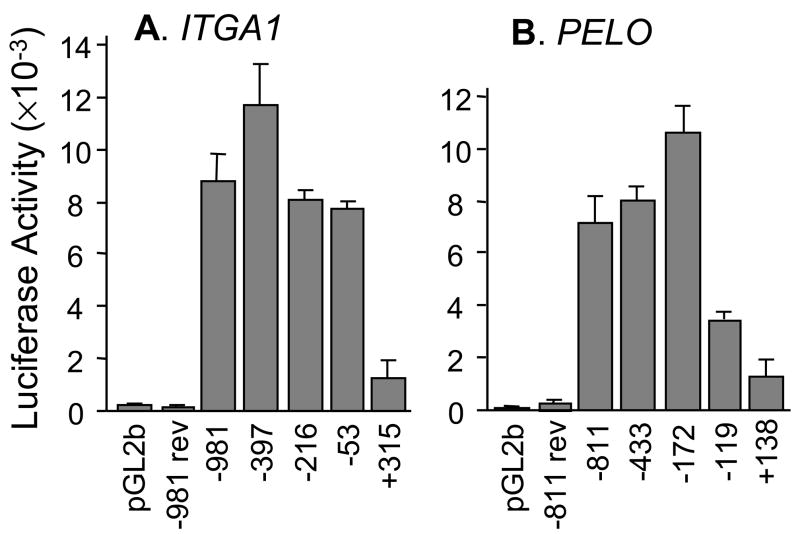
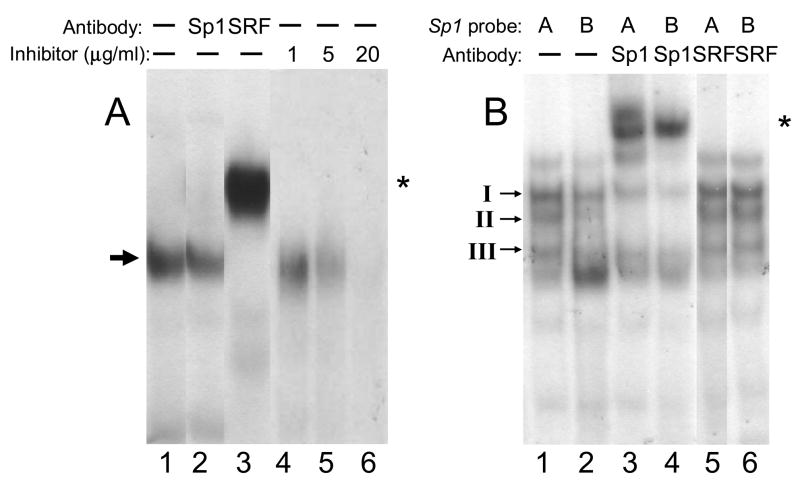
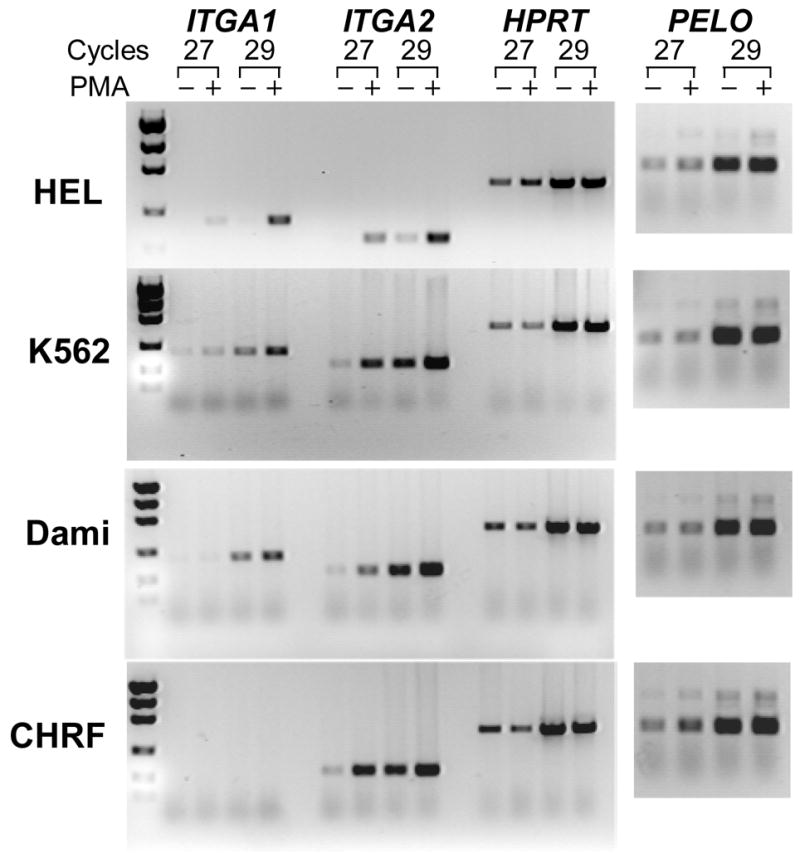
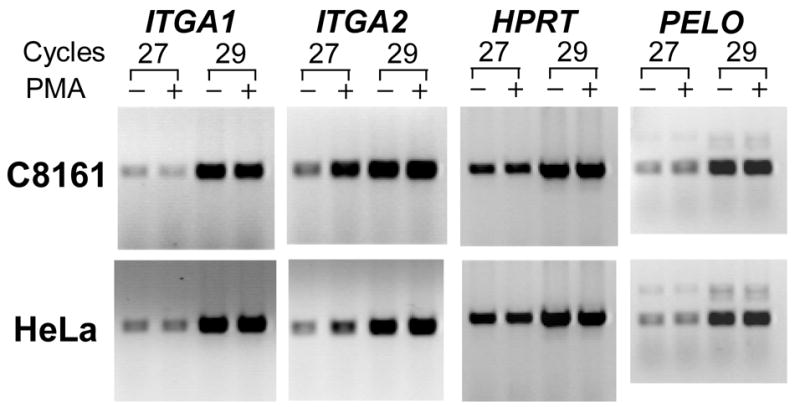
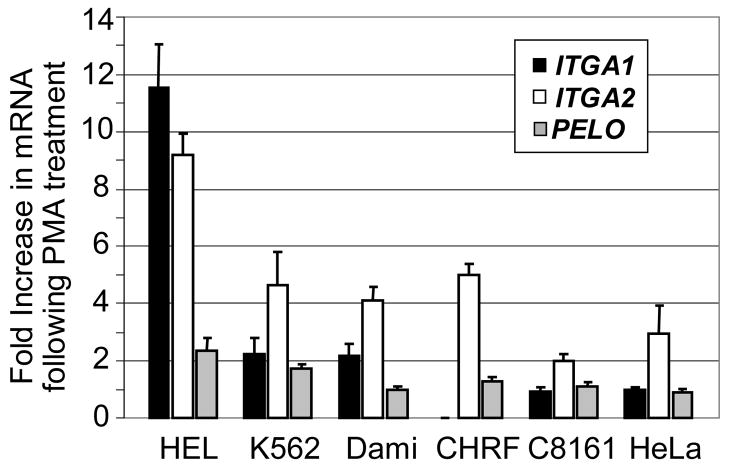
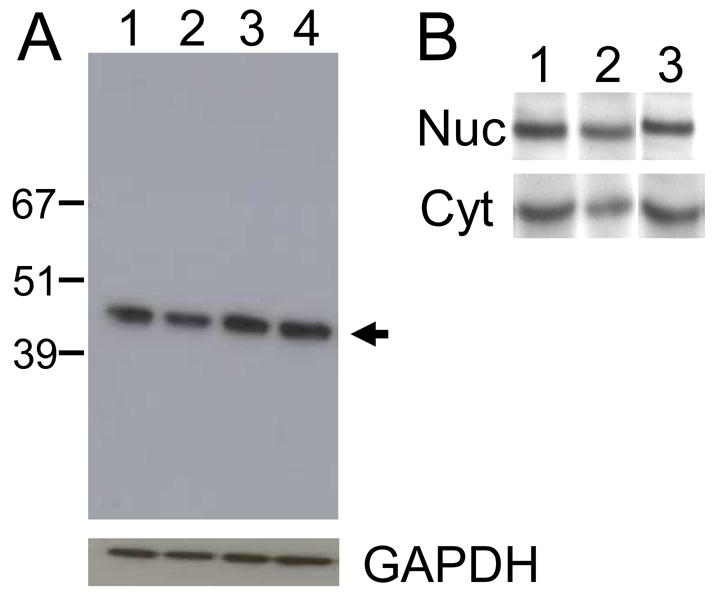
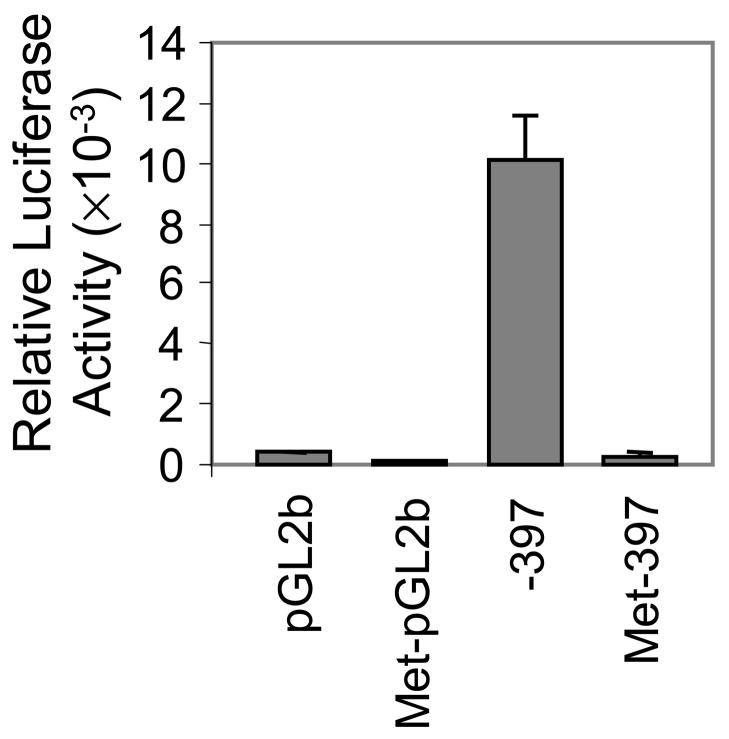
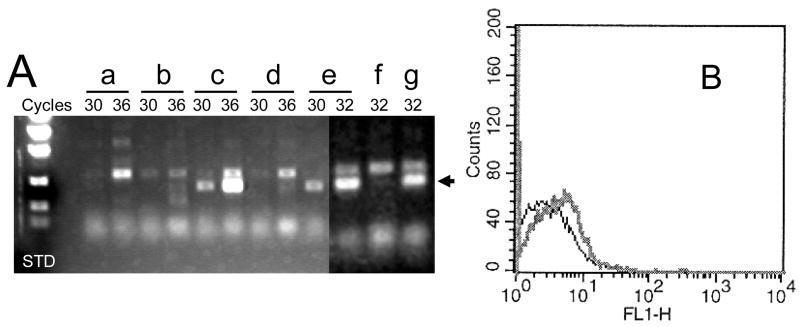
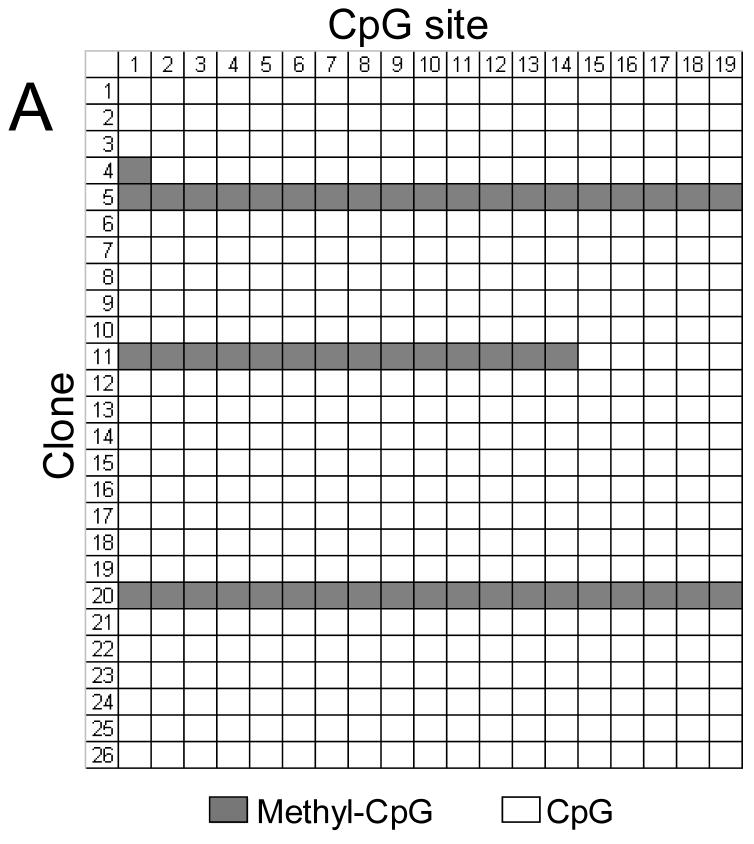
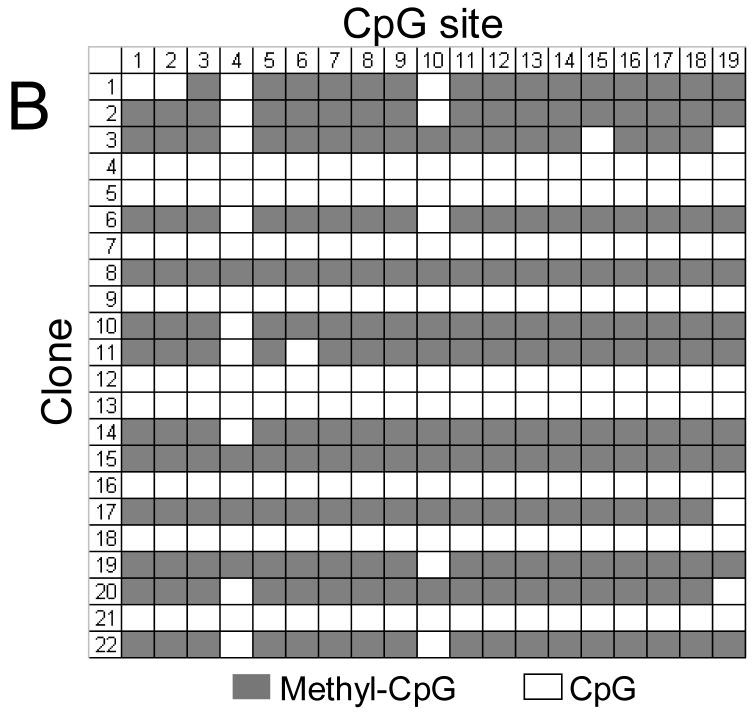
The integrin collagen receptor locus on human chromosome 5q11.2 includes the integrin genes ITGA1 and ITGA2, and the cell cycle regulation gene PELO, embedded within ITGA1 intron 1. ITGA1 contains a CArG box that is bound by serum response factor (SRF), while PELO contains two Sp1 binding elements. A comparison of mRNA levels in megakaryocytic (MK) and non-megakaryocytic (non-MK) cell lines and an analysis of the transcriptional activity of promoter-LUC reporter gene constructs in transfected cells revealed that ITGA1 is selectively suppressed in the MK lineage. Sodium bisulfite genomic sequencing established that a CpG-rich ITGA1 promoter region (-209/+115) is fully methylated at 19 CpG sites in MK cells that do not express alpha1beta1, but completely demethylated in expressing cells. In vitro methylation of ITGA1 suppresses transcription, while treatment of megakaryocytic cells with 5-aza-2'-deoxycytidine, but not Trichostatin A, resulted in de novo expression of ITGA1. During thrombopoietin-induced in vitro differentiation of primary human cord blood mononuclear cells into megakaryocytes, we observed rapid, progressive CpG methylation of ITGA1, but not PELO or ITGA2. Thus, selective CpG methylation of the ITGA1 promoter is a specific feature of alpha1beta1 regulation that coincides with the initiation of megakaryocyte differentiation.


Figures

FIGURE 1
FIGURE 1
(A) The human ITGA1-PELO-ITGA2 locus is situated on chromosome 5q11.2 ITGA1 is separated from ITGA2 by only 32 Kb. The locus is demarcated by the expressed sequence tag (EST) D5S202 at the 5′ end, D5S623 in the center and D5S2037 at the 3′ end. (B) The human PELO gene is embedded within intron 1 of ITGA1. Human PELO consists of two translated exons (Exons 2 and 3) that encode the 385 amino acid protein, pelota. An untranslated Exon 1 starts 11.1kb downstream from the beginning of ITGA1 intron 1.
FIGURE 2
FIGURE 2
ITGA1 5′ regulatory region and proximal promoter sequence (−300/+414). Nucleotide sequence numbering (from NM_181501) is shown to the left of text lines relative to the transcription start site (*). Exon 1 is indicated by uppercase lettering, and the ATG start codon is double underlined. 5′-regulatory, noncoding sequence is indicated by lowercase lettering. The segment employed for bisulfite DNA sequencing experiments is underlined, and each CpG site within that segment is indicated by bold text and numbered consecutively above the text line. A sequence (+25/+52) that is nearly identical (89%) between chicken [2] and human DNA is highlighted in gray, and the position of a CArG box within that sequence is indicated above the text line.
FIGURE 3
FIGURE 3
PELO 5′ regulatory region and proximal promoter sequence (−500/+246). Nucleotide sequence numbering (from NM_015946) is shown to the left of text lines relative to the transcription start site (*). Exon 1 is indicated by uppercase lettering, and the ATG start codon is double underlined. 5′-regulatory, noncoding sequence is indicated by lowercase lettering. The segment employed for bisulfite DNA sequencing experiments is underlined, and each of 33 CpG sites within that segment is indicated by bold text. Two Sp1 binding sites are highlighted in gray: Sp1 A at −137/−128 and Sp1 B at +130/+139.
FIGURE 4
FIGURE 4
Deletion analysis of the proximal 5′-regulatory region of A) ITGA1 or B) PELO. A) A series of reporter plasmids containing fragments of the 5′-region of human ITGA1 extending from −981, −397, −216, −53, or +315 and through +455 were inserted upstream from the LUC reporter gene in pGL2basic (pGL2b) and transfected into Dami cells. Baseline activity was measured with the pGL2basic (pGL2b) vector alone. Co-transfection of the PRL-TK plasmid was used to normalize for transfection efficiency. Each vertical bar represents the mean +/− 1 SD for three independent experiments. For each construct depicted on the abscissa, relative luciferase activity is indicated on the ordinate. −981 rev represents the entire 5′-sequence from −981 to +455 inserted in the reverse orientation. B) A series of reporter plasmids containing fragments of the 5′-region of human PELO extending from −811, −433, −172, −119, or +138 and through +180 were inserted upstream from the LUC reporter gene in pGL2basic (pGL2b) and transfected into Dami cells. Baseline activity was measured with the pGL2basic (pGL2b) vector alone. Each vertical bar represents the mean +/− 1 SD for four independent experiments. For each construct depicted on the abscissa, relative luciferase activity is indicated on the ordinate. −811 rev represents the entire 5′-sequence (−811/+180) inserted in the reverse orientation.
FIGURE 5
FIGURE 5
Binding of nuclear proteins to oligonucleotides containing (A) the ITGA1 CArG-like site (residues +35/+43) or (B) the PELO Sp1 site A (residues −146/−119) or site B (residues +121/+148). (A) Nuclear extracts were prepared from HEK293 cells and incubated with the radiolabeled ITGA1 CArG box oligonucleotide probe (Table 1) either in the absence of antiserum (lanes 1, 4, 5 and 6) or following incubation with anti-Sp1 (lane 2) or anti-SRF (lane 3). Additional aliquots of the extract were incubated with the radiolabeled ITGA1 CArG box oligonucleotide probe in the presence of 1, 5 or 20 μg/ml of unlabelled ACTA1 CArG oligonucleotide (Table 1), as a competitor oligonucleotide (lanes 4–6, respectively). Arrow to the left of the gel indicates SRF complex; asterisk to the right of the gel denotes the supershifted complex. (B) Nuclear extracts were prepared from Dami cells and incubated with radiolabeled PELO oligonucleotide probes (Table 1) corresponding to Sp1 site A (lanes 1, 3 and 5) or Sp1 site B (lanes 2, 4 and 6) either in the absence of antiserum (lanes 1 and 2) or following incubation with anti-Sp1 (lanes 3 and 4) or anti-SRF (lanes 5 and 6). The positions of Sp1/Sp3 complexes I, II, and III [20] are indicated to the left of the gel. Asterisk to the right of the gel denotes supershifted complexes. Lanes 2 and 3 in (A) and lane 5 in (B) are inserted slices from separate experiments, each of which included identical positive and negative controls,
FIGURE 6
FIGURE 6
The expression of ITGA1, ITGA2, PELO and the housekeeping gene HPRT in human cell lines. (A) The level of mRNA in each cell line was measured semi-quantitatively using limiting cycle RT-PCR. For each of the four mRNAs, the cDNA product obtained after 27 or 29 cycles was separated by agarose gel electrophoresis and visualized with ethidium bromide. Comparisons were made between cells cultured in the presence (+) of 5 nmol/L phorbol myristate (PMA) or an equal volume of DMSO (−) for 24 hours. Total RNA was reverse transcribed and the cDNA obtained was used for PCR amplification. Both the megakaryocytic (MK) cell lines HEL, K562, Dami, and CHRF-288-11 and the non-MK cell lines C8161 and HeLa were studied.
FIGURE 6
FIGURE 6
The expression of ITGA1, ITGA2, PELO and the housekeeping gene HPRT in human cell lines. (A) The level of mRNA in each cell line was measured semi-quantitatively using limiting cycle RT-PCR. For each of the four mRNAs, the cDNA product obtained after 27 or 29 cycles was separated by agarose gel electrophoresis and visualized with ethidium bromide. Comparisons were made between cells cultured in the presence (+) of 5 nmol/L phorbol myristate (PMA) or an equal volume of DMSO (−) for 24 hours. Total RNA was reverse transcribed and the cDNA obtained was used for PCR amplification. Both the megakaryocytic (MK) cell lines HEL, K562, Dami, and CHRF-288-11 and the non-MK cell lines C8161 and HeLa were studied.
FIGURE 7
FIGURE 7
Quantitation of the fold-increase in mRNA expression induced by PMA. From the results depicted in FIGURE 6 for each of the six cells lines indicated on the abscissa, the density of ethidium-bromide stained DNA bands was measured by optical scanning, and the fold-increase in density in PMA-treated samples relative to non-PMA treated samples was calculated. The results are the mean +/− 1 SD of three independent experiments. The increase in mRNA (band density) following PMA treatment is plotted on the ordinate. A value of 1 represents no increase; while a value of 2 represents a one hundred percent increase or doubling of the density. Levels of ITGA1 mRNA are indicated by black vertical bars; ITGA2 mRNA, by white bars, and PELO mRNA by gray bars.
FIGURE 8
FIGURE 8
Cellular content of pelota. (A) The relative total cell content of pelota was determined by western blot. Equal amounts of total cell protein (15 μg) from (lane 1) Dami cells, (lane 2) CHRF288-11 cells, (lane 3) K562 cells, or (lane 4) HeLa cells were separated by SDS-polyacrylamide gel electrophoresis and transferred to a nitrocellulose membrane. The position of representative molecular weight marker proteins is indicated to the left of the gel. Pelota was visualized by the binding of murine monoclonal anti-pelota antibody 1A3, and its position is indicated by the arrow to the right of the gel. (B) Legend as in A except that nuclear protein (Nuc) and cytoplasmic protein (Cyt) were separated prior to SDS-PAGE. The cell lines employed were: (lane 1) Dami, (lane 2) CHRF288-11, and (lane 3) K562.
FIGURE 9
FIGURE 9
Inhibition of ITGA1 promoter activity by in vitro methylation. The ITGA1 promoter construct (−397/+455) and pGL2b vector alone (control) were methylated in vitro with SssI methylase and transfected into Dami cells. Co-transfection of PRL-TK plasmid was used to normalize for transfection efficiency. The relative Luciferase activity for each transiently transfected cell preparation was measured and is plotted on the ordinate The activity of each of four constructs (abscissa) is compared: pGL2b; methylated pGL2b (Met-pGL2b); ITGA1 promoter (−397); and methylated ITGA1 promoter (Met-397).
FIGURE 10
FIGURE 10
Expression of ITGA1 mRNA in CHRF288-11 cells after the treatment with 5-aza-deoxyCytidine (5-AZA) or Trichostatin A (TSA). (A) The cDNA product amplified by RT-PCR after 30, 32 or 36 cycles is depicted for cells were (a) untreated or treated with (b) 0.01 % (v/v) DMSO for 24 hrs; (c) 5μM 5-AZA for 24 hrs; (d) DMSO for 48 hrs; (e) 5-AZA for 48 hrs; (e) TSA for 48 hrs; or (f) 5-AZA plus TSA for 48 hrs. The arrow in the right hand margin denotes the position of the expected ITGA1 cDNA product. (B) The surface expression of integrin α1 at 48 hours after treatment with 5-AZA (gray curve) is shifted to the right relative to that obtained for cells treated with DMSO (black curve), as measured by flow cytometry using monoclonal anti-α 1 antibody.
FIGURE 11
FIGURE 11
Methylation status of the ITGA1 promoter CpG-rich region of (A) cord blood mononuclear cells (MNC) or (B) CD41+ cells, enriched by culture in the presence of recombinant human thrombopoietin (rhTPO). In each grid, each CpG site is represented by a column that is numbered at the top, while individual cloned DNA sequences are represented by a row that is numbered to the left. Methylated CpG sites are indicated as filled squares, and unmethylated sites as open squares. Numbers at the top correspond to the same CpG sites shown in Figures 2 or 11. Mononuclear cells (MNCs) from human cord blood were isolated and cultured in the presence of rhTPO for 8days. CD41+ cells were selected, and genomic DNA was isolated, bisulfite treated, and amplified by PCR, targeting the ITGA1 CpG-rich region. In MNC (A), 2 of 26 clones (#5 and #20) showed complete methylation of each of 19 sites, while a third clone (#11) showed methylation at sites 1 through 14 (3/26 = 11%); in the CD41+ enriched cells derived from these progenitors (B), 13 of 22 clones (59%) showed methylation of at least 16 of the 19 sites.
FIGURE 11
FIGURE 11
Methylation status of the ITGA1 promoter CpG-rich region of (A) cord blood mononuclear cells (MNC) or (B) CD41+ cells, enriched by culture in the presence of recombinant human thrombopoietin (rhTPO). In each grid, each CpG site is represented by a column that is numbered at the top, while individual cloned DNA sequences are represented by a row that is numbered to the left. Methylated CpG sites are indicated as filled squares, and unmethylated sites as open squares. Numbers at the top correspond to the same CpG sites shown in Figures 2 or 11. Mononuclear cells (MNCs) from human cord blood were isolated and cultured in the presence of rhTPO for 8days. CD41+ cells were selected, and genomic DNA was isolated, bisulfite treated, and amplified by PCR, targeting the ITGA1 CpG-rich region. In MNC (A), 2 of 26 clones (#5 and #20) showed complete methylation of each of 19 sites, while a third clone (#11) showed methylation at sites 1 through 14 (3/26 = 11%); in the CD41+ enriched cells derived from these progenitors (B), 13 of 22 clones (59%) showed methylation of at least 16 of the 19 sites.

Similar articles

Cited by

References

    1. Hughes AL. Evolution of the Integrin alpha and beta Protein Families. J Mol Evol. 2001;52:63. - PubMed
    1. Obata H, Hayashi K, Nishida W, Momiyama T, Uchida A, Ochi T, Sobue K. Smooth muscle cell phenotype-dependent transcriptional regulation of the alpha1 integrin gene. J Biol Chem. 1997;272:26643. - PubMed
    1. Nishida W, Nakamura M, Mori S, Takahashi M, Ohkawa Y, Tadokoro S, Yoshida K, Hiwada K, Hayashi K, Sobue K. A triad of serum response factor and the GATA and NK families governs the transcription of smooth and cardiac muscle genes. J Biol Chem. 2002;277:7308. - PubMed
    1. Eberhart CG, Wasserman SA. The pelota locus encodes a protein required for meiotic cell division: an analysis of G2/M arrest in Drosophila spermatogenesis. Development. 1995;121:3477. - PubMed
    1. Shamsadin R, Adham IM, Engel W. Mouse pelota gene (Pelo): cDNA cloning, genomic structure, and chromosomal localization. Cytogenet Genome Res. 2002;97:95. - PubMed

Publication types

MeSH terms

LinkOut - more resources