. 2007 Oct;27(19):6913-32.
doi: 10.1128/MCB.01695-06. Epub 2007 Jul 23.

Regulation of SRC-3 intercompartmental dynamics by estrogen receptor and phosphorylation

Affiliations

Regulation of SRC-3 intercompartmental dynamics by estrogen receptor and phosphorylation

Larbi Amazit et al. Mol Cell Biol. 2007 Oct.

Abstract

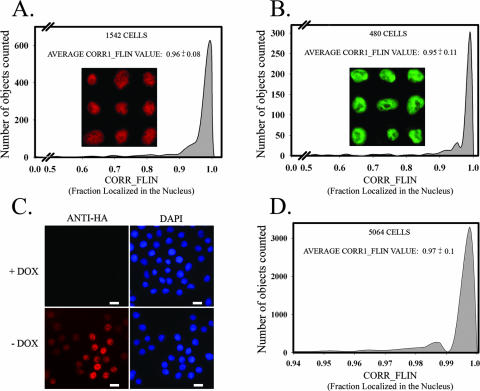
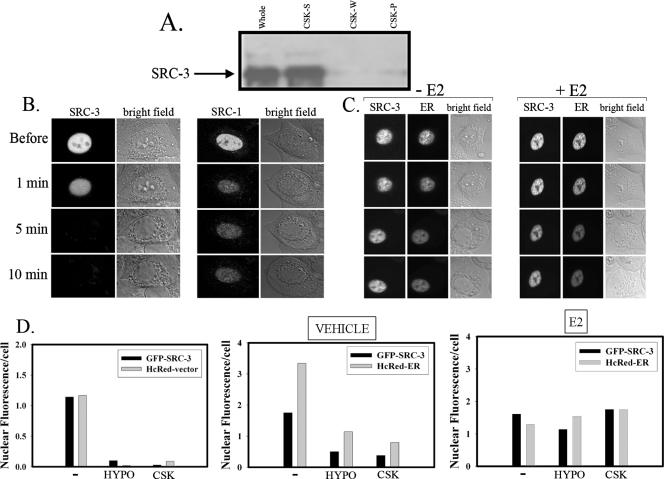
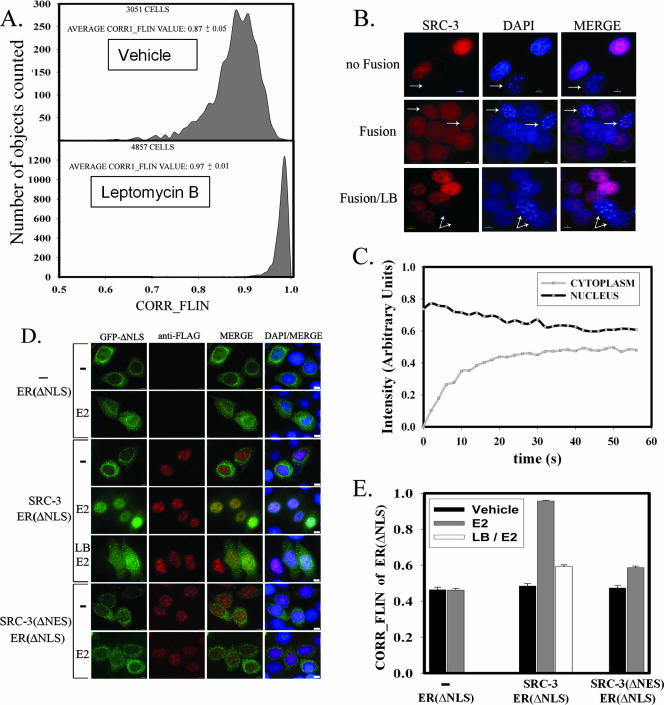
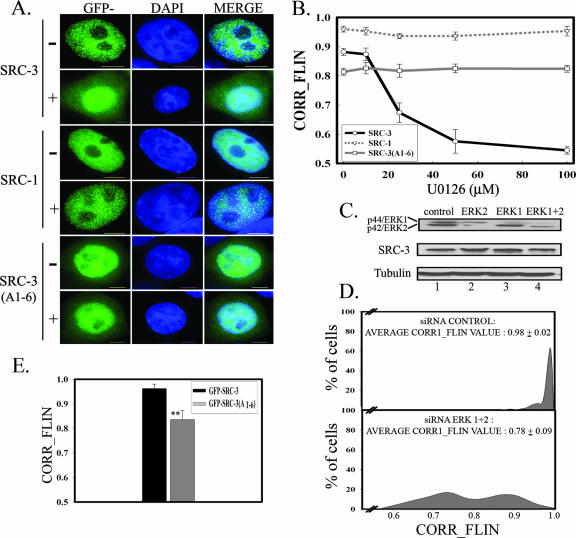
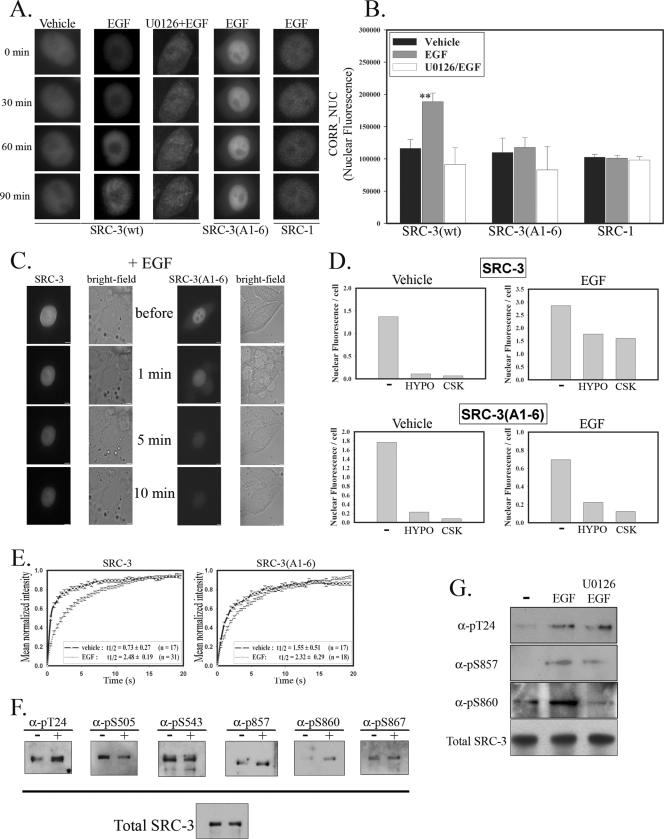
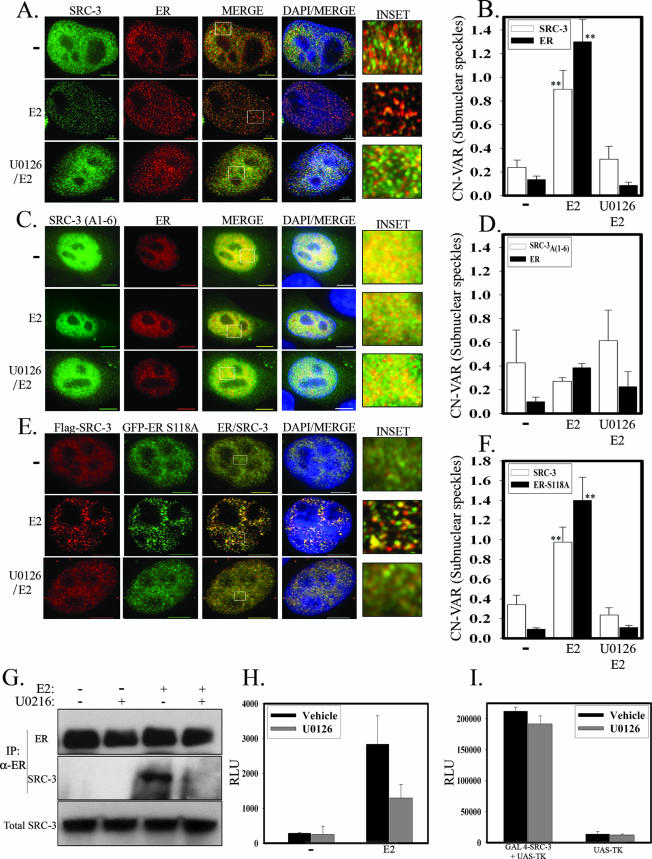
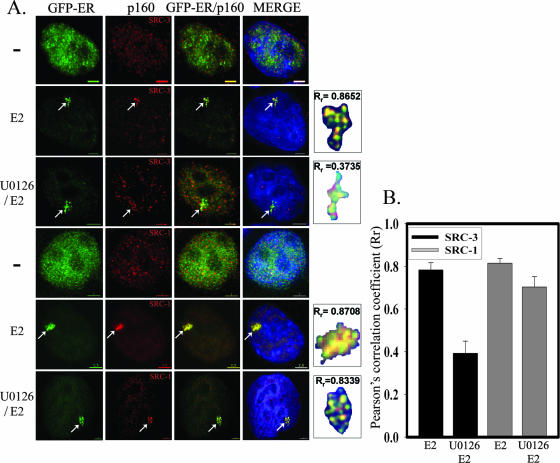
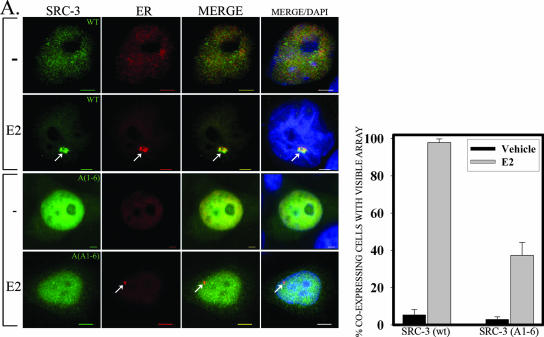
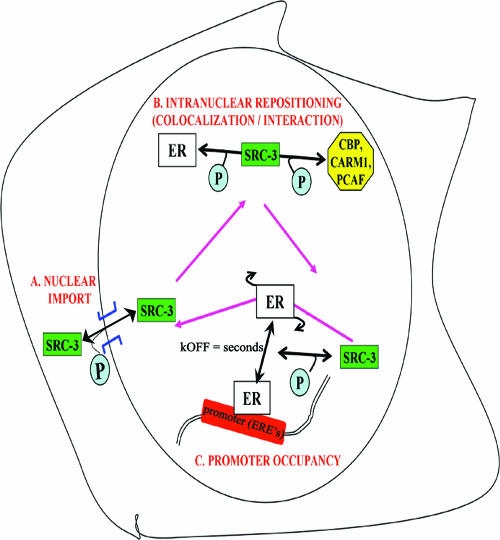
The steroid receptor coactivator 3 gene (SRC-3) (AIB1/ACTR/pCIP/RAC3/TRAM1) is a p160 family transcription coactivator and a known oncogene. Despite its importance, the functional regulation of SRC-3 remains poorly understood within a cellular context. Using a novel combination of live-cell, high-throughput, and fluorescent microscopy, we report SRC-3 to be a nucleocytoplasmic shuttling protein whose intracellular mobility, solubility, and cellular localization are regulated by phosphorylation and estrogen receptor alpha (ERalpha) interactions. We show that both chemical inhibition and small interfering RNA reduction of the mitogen-activated protein kinase/extracellular signal-regulated kinase 1/2 (MEK1/2) pathway induce a cytoplasmic shift in SRC-3 localization, whereas stimulation by epidermal growth factor signaling enhances its nuclear localization by inducing phosphorylation at T24, S857, and S860, known participants in the phosphocode that regulates SRC-3 activity. Accordingly, the cytoplasmic localization of a nonphosphorylatable SRC-3 mutant further supported these results. In the presence of ERalpha, U0126 also dramatically reduces (i) ligand-dependent colocalization of SRC-3 and ERalpha, (ii) the formation of ER-SRC-3 complexes in cell lysates, and (iii) SRC-3 targeting to a visible, ERalpha-occupied and -regulated prolactin promoter array. Taken together, these results indicate that phosphorylation coordinates SRC-3 coactivator function by linking the probabilistic formation of transient nuclear receptor-coactivator complexes with its molecular dynamics and cellular compartmentalization. Technically and conceptually, these findings have a new and broad impact upon evaluating mechanisms of action of gene regulators at a cellular system level.


Figures

FIG. 1.
FIG. 1.
SRC-3 is a predominantly nuclear protein. (A and B) Automated quantification of SRC-3 subcellular localization using high-resolution HTM. HeLa cells were grown for 48 h in hormone-free medium. Shown are filled-area histograms of FLIN obtained for the cell population scanned. FLIN values for endogenous SRC-3 (A) and transiently expressed GFP-SRC-3 (B) were measured. The numbers of cells analyzed and the FLIN averages are indicated. (Inset) Representative cell objects which belong to the extracted subpopulation are shown as examples. (C) Immunodetection of SRC-3 with an antibody to HA in HeLa cells stably expressing HA-SRC-3 under the control of a Tet promoter. The expression of exogenous SRC-3 was repressed in the presence of doxycycline (+ DOX) (200 ng/ml) in hormone-free medium. To express HA-SRC-3, cells were grown in DOX-free medium (− DOX) during 48 h. HA-SRC-3 was expressed in the nucleus as shown by immunodetection using anti-HA antibodies. DAPI staining delineates the nuclei (bar, 10 μm). (D) FLIN area-filled histograms of the doxycycline-free cell population analyzed in C.
FIG. 2.
FIG. 2.
SRC-3 extractability is modulated by ER. (A) SRC-3 is not tightly bound within the nucleus. An antibody against SRC-3 was used to probe a Western blot of HeLa cell lysates. Whole-cell extract, CSK extraction buffer supernatant (CSK-S), a second CSK buffer washout (CSK-W), and resuspended CSK pellet (CSK-P) were analyzed. (B) Real-time monitoring of a cell expressing YFP-SRC-3 before and 1, 5, and 10 min after perfusion with ice-cold HYPO buffer. Bright-field phase images show that the cell remained in place and became rounded and swollen as a result of exposure to the buffer. All imaging parameters were held constant within each set of images. For comparison, the same protocol was used to extract YFP-SRC-1 expressed in HeLa cells (right two panels). (C) Real-time monitoring of a cell coexpressing YFP-SRC-3 and CFP-ER before and 1, 5, and 10 min after perfusion with ice-cold HYPO buffer. The coexpression of CFP-ER with YFP-SRC-3, either with or without 10 nM E2, leads to a significant increase in the retention of nuclear SRC-3. (D) Automated HTM quantification of GFP-SRC-3 fluorescence. In situ extraction of SRC-3 was performed in HeLa cells transiently expressing GFP-SRC-3 alone (left histogram) or with GFP-SRC-3 coexpressed with HcRed-ER (middle and right histograms). Cells were grown for 48 h in hormone-free medium and treated for 1 h with vehicle or hormone. Cells were then permeabilized (indicated by “−”) and treated with HYPO or CSK buffer for 3 min. Fixed cells were analyzed by HTM: the same numbers of fields (100 fields) were automatically scanned, and the cell population obtained was quantified for the total average nuclear fluorescence/cell for each condition.
FIG. 3.
FIG. 3.
Intranuclear mobility and subnuclear localization of SRC-3 are influenced by ER in live cells. (A) Cells were transfected with GFP-SRC-3 (bottom) or GFP-SRC-1 (top). A region corresponding to ∼25% of the size of the nucleus was photobleached. In the case of SRC-3, note the dramatic decrease of all the fluorescence of the nuclear pool within the nucleus, which demonstrates the extremely rapid movement of the coactivator. In the case of GFP-SRC-1, only a clearly bleached region is apparent, indicating the relatively slower movement of SRC-1. (B) Recovery of fluorescence over time for both SRC-3 and SRC-1. The data plots are the averages of normalized intensity (in arbitrary units) (mean ± SEM). In the inset, n indicates the number of cells analyzed for each coactivator. (C) Fluorescence microscopy was performed on cells expressing CFP-ER (pseudocolored in green) and YFP-SRC-3 (pseudocolored in red). Forty-eight hours after transfection, cells were treated with 10 nM E2 for 2 h or with vehicle (−) and then fixed and counterstained with DAPI. A z series of focal planes was digitally imaged and deconvolved with the DeltaVision constrained iterative algorithm to generate high-resolution images. In the absence of hormone (top row), CFP-ER and YFP-SRC-3 were diffusely distributed in the nucleus. The addition of ligand (bottom row) resulted in a redistribution of both proteins into the same foci, some of which are indicated by arrows (bar, 5 μm). (D) Intranuclear mobility of SRC-3 is reduced in the presence of ER. SRC-3 photobleaching experiments were performed on cells cotransfected with CFP-ER and YFP-SRC-3. The histogram shows the recovery t1/2 values of YFP-SRC-3 alone and in the presence of ligand-free and ligand-bound CFP-ER (n = 42, n = 14, and n = 17, respectively). In the presence of ER, SRC-3 mobility decreases, as indicated by the increased t1/2, suggesting that basal interactions may occur even in the absence of ligand. SRC-3 mobility is further reduced in the presence of E2, indicating that ER-SRC-3 complexes are stabilized by ligand.
FIG. 4.
FIG. 4.
SRC-3 rapidly shuttles between the nucleus and cytoplasm. (A) Automated quantification of SRC-3 nuclear localization after treatment with leptomycin B. T47D cells were cultured for 48 h in hormone-free medium and then incubated with leptomycin B (LB) (40 nM) or vehicle (dimethyl sulfoxide) for 4 h. Cells were fixed, immunolabeled for endogenous SRC-3, and then analyzed by HTM. FLIN values were determined for each cell, and the corresponding filled-area histogram was plotted for each condition. The average FLIN values are also indicated in addition to the number of cells analyzed. Note the shift of the histogram to the right in the presence of leptomycin B, which is indicative of an increased nuclear localization of SRC-3 in the cell population. (B) Transfer of SRC-3 from human to mouse nuclei in interspecific heterokaryons. Human (HeLa) and mouse (MEF) (arrows) cells are distinguished by the DAPI staining showing specific heterochromatic DNA in MEF cells. HeLa cells containing endogenous SRC-3 were fused to mouse SRC-3−/− MEFs (devoid of SRC-3). One hour before fusion, cycloheximide (50 μg/ml) was administered to prevent new synthesis of the coactivator. One hour after fusion, cells were fixed and immunolabeled for SRC-3. Note the absence of SRC-3 in the MEF−/− cells when the cells were cocultured together but not fused (bar, 5 μm). (C) Kinetics of SRC-3 nucleocytoplasmic shuttling. HeLa cells with a cell-wide distribution of GFP-SRC-3 were analyzed by FLIP. Cells were photobleached in the cytoplasm, and fluorescence was subsequently measured (every 5 s for 60 s) in both the nucleus and cytoplasm. Following cytoplasmic bleaching, nuclear GFP-SRC-3 fluorescence decreased, while cytoplasmic fluorescence increased, reaching new steady-state levels within 60 s. (D) Hormone-dependent interaction between SRC-3 and ER(ΔNLS) takes place and results in the cotransportation of coactivator/receptor into the nucleus. A GFP-ER mutant lacking amino acids 250 to 303 [ER(ΔNLS)] was cotransfected with empty vector (−), Flag-SRC-3, or a Flag-SRC-3 mutant lacking amino acids 1031 to 1130 [Flag-SRC-3(ΔNES)]. Forty hours after transfection, cells were incubated with E2 (10 nM) during 8 h in the presence of 50 μg/ml cycloheximide and then fixed and immunolabeled with anti-Flag antibodies. Where indicated, cells were pretreated with leptomycin B for 30 min and then further incubated with E2/leptomycin B during 8 h. A z series of focal planes was digitally imaged and deconvolved with the DeltaVision constrained iterative algorithm to generate a high-resolution picture. DAPI staining delineates the nuclei (bar, 2.5 μm). Note that the E2-induced shift of ER(ΔNLS) in the nucleus does not occurs in the presence of leptomycin B or when coexpressed with SRC-3(ΔNES) (bar, 5 μm). (E) Automated quantification of ER(ΔNLS) subcellular localization using high-resolution HTM. The histograms show the average FLIN values obtained for hundreds of cells scanned from the experiment described for panel D. Error bars represent SE.
FIG. 5.
FIG. 5.
Inhibition of SRC-3 phosphorylation impedes its nuclear localization. (A) HeLa cells expressing GFP-SRC-3, GFP-SRC-1, or GFP-SRC-3(A1-6) were cultured for 48 h in hormone-free medium and then incubated for 4 h with the MEK kinase inhibitor U0126 (45 μM) or vehicle as a control in the presence of cycloheximide (50 μg/ml). DAPI staining delineated the nucleus. GFP-SRC-3 was partially shifted to the cytoplasm in the presence of the inhibitor. Bar, 5 μm. (B) Dose-response curve showing the effect of U0126 on SRC-3 subcellular localization using high-resolution HTM. HeLa cells were transfected with the indicated expression vector in a 96-well format. Cells were incubated in triplicate with U0126 (0 to 100 μM) 48 h after transfection. Cycloheximide (50 μg/ml) was added to the medium at the same time as the inhibitor. In each well, FLIN values were collected for each cell. Data shown are the average FLIN values of three wells for each condition. Error bars represent standard deviations (SD). (C) Knockdown of both kinases by siRNAs was demonstrated by immunoblotting with anti-ERK1/2 antibodies. Cells were transfected with siRNA ERK1, siRNA ERK2, both together (siRNA ERK1+2), or a control siRNA. Seventy-two hours after transfection, cells were collected, and proteins were extracted for Western blot analysis. For protein loading controls, levels of tubulin and SRC-3 were determined after stripping and reprobing of the membranes with corresponding antibodies. (D) HTM automated quantification of SRC-3 subcellular localization. Coverslips corresponding to lanes 1 (control siRNA) and 4 (siRNA ERK1+2) of the experiment described above (C) were treated for immunohistochemistry and then scanned randomly. The percentage of cells with the corresponding FLIN values were determined, and the corresponding filled-area histogram was plotted for each condition. The average FLIN values are also indicated. Note that RNAi of ERK1 and ERK2 resulted in a decreased FLIN level of SRC-3 compared to control siRNA. (E) A nonphosphorylatable SRC-3 mutant shows altered subcellular localization. HeLa cells were transfected in triplicate with the expression vector for GFP-SRC-3 (wild type) and the nonphosphorylatable mutant form in which the six serine/threonine phosphorylation sites were replaced by alanine [GFP-SRC-3(A1-6)]. Cells were cultured for 48 h in hormone-free medium, fixed, immunolabeled, and then analyzed by high-resolution HTM. The histograms show the average FLIN values collected in triplicate for each condition (**, P < 0.01) (error bars represent SD).
FIG. 6.
FIG. 6.
EGF-mediated phosphorylation of SRC-3 enhances its nuclear localization. (A) Real-time in vivo monitoring of GFP-SRC-3, GFP-SRC3(A1-6), and GFP-SRC-1 upon the addition of EGF (100 ng/ml). HeLa cells were transfected with the indicated vectors and incubated with EGF for 1.5 h. In lane 3 (U0126 plus EGF), cells were first preincubated for 3 h with U0126 (45 μg/ml). (B) Automated quantification of SRC-3 subcellular localization upon EGF treatment using high-resolution HTM. HeLa cells were transfected with GFP-SRC-3, GFP-SRC-3(A1-6), or GFP-SRC-1 and treated for 1.5 h with EGF (100 ng/ml). Cells were fixed, DAPI stained, and analyzed by HTM. The histograms show the nuclear fluorescence intensity values obtained for hundreds of cells in the absence or presence of EGF and in cells pretreated with U0126 inhibitor (**, P < 0.01) (error bars represent SD). (C) Real-time monitoring of SRC-3 extractability upon EGF treatment. HeLa cells expressing GFP-SRC-3 or GFP-SRC-3(A1-6) were grown in hormone-free medium during 48 h. Cells were then incubated with 100 ng/ml EGF during 1.5 h and monitored before and 1, 5, and 10 min after perfusion with ice-cold HYPO buffer. Bright-field phase images show that the cell remained in place and became rounded and swollen as a result of exposure to the buffer. All imaging parameters were held constant within each set of images. Note the resistance of SRC-3 to extraction compared to SRC-3(A1-6). (D) Automated HTM quantification of GFP-SRC-3 and GFP-SRC-3(A1-6) after in situ extraction in the presence of EGF. Transfected cells were grown for 48 h in hormone-free medium and treated for 1.5 h with vehicle or EGF (100 ng/ml). Cells were then permeabilized (indicated by “−”) and treated with ice-cold HYPO or CSK buffer for 3 min. After fixation, cells were analyzed by HTM: the same numbers of fields (100 fields) were automatically scanned, and the cell population obtained was quantified for the average nuclear fluorescence/cell for each condition. (E) Intranuclear mobility of SRC-3 is reduced in the presence of EGF. Photobleaching experiments were performed on HeLa cells expressing GFP-SRC-3 or GFP-SRC-3(A1-6). Transfected cells were grown for 48 h in hormone-free medium and treated with or without 100 ng/ml EGF for 1.5 h. The graphs represent the averages of normalized intensity (in arbitrary units) (mean ± SEM). In the left panel, the graph representing GFP-SRC-3 alone (Fig. 3B) was inserted for comparison. The inset box indicates the t1/2 of fluorescence recovery for each condition and the number of cells analyzed (n). (F) EGF induces phosphorylation of SRC-3 at specific sites. HEK293 cells grown in phenol red-free DMEM (supplemented with 5% charcoal-dextran-stripped FBS) were cotransfected with an expression plasmid for wild-type Flag-SRC-3. After transfection, cells were grown in medium containing 0.5% FBS for 36 h and stimulated with EGF (100 ng/ml) for 1 h before harvest. Flag-SRC-3 was immunoprecipitated by anti-Flag antibodies and separated on an 8% sodium dodecyl sulfate-polyacrylamide gel. Immunoblotting was performed using the indicated phosphorylation state-specific antibodies. All membranes used for experiments were stripped and reprobed with anti-Flag antibodies to control for protein loading (total f-SRC-3). (G) U0126 inhibits EGF-induced phosphorylation of SRC-3 at specific sites. Cells were treated as described above (F), except for the right lane, where the cells were preincubated with U0126 (45 μg/ml) for 1 h. Immunoblotting was performed using the indicated phosphorylation state-specific antibodies.
FIG. 7.
FIG. 7.
SRC-3 phosphorylation by MAPK is necessary for its interaction with ER. (A) HeLa cells expressing GFP-SRC-3 and HcRed-ER were incubated in hormone-free medium for 48 h. Cells were then incubated for 2 h with or without 10 nM E2 (vehicle or E2). Where indicated, U0126/E2 cells were pretreated for 2 h with U0126 (45 μM) and further treated with E2 for 2 h. A z series of focal planes was digitally imaged and deconvolved with the DeltaVision constrained iterative algorithm to generate high-resolution images. The inset shows a magnification of the selected subnuclear region (white square). (B) Automated HTM quantification of the subnuclear pattern variation. HeLa cells transiently expressing GFP-SRC-3 and HcRed-ER were treated as described above (A) and analyzed by high-resolution HTM with a 60× objective. The histograms show the subnuclear variation measurement (CN_VAR × 10−2), which is the statistical variation in pixel brightness for each channel (SRC-3 and ER) in the nuclear compartment. Note that the increase in CN_VAR for both SRC-3 and ER in the presence of hormone is inhibited by U0126 (error bars represent SE). (C) HeLa cells expressing GFP-SRC-3(A1-6) and HcRed-ER were treated and analyzed as described above (A). (D) Automated HTM quantification of the variation in the subnuclear pattern of GFP-SRC-3(A1-6) and ER. CN_VAR quantifications were processed as described above (B). (E) HeLa cells expressing Flag-tagged SRC-3 (Flag-SRC-3) (in red) and GFP-ER(S118A) (in green) were treated and analyzed as described above (A) except that after fixation, SRC-3 was immunodetected with anti-Flag antibody. (F) Automated HTM quantification of the variation in the subnuclear pattern of Flag-SRC-3 and GFP-ER(S118A). CN_VAR quantifications were processed as described above (B). (G) MCF-7 cells were incubated for 3 days in 5% stripped-dialyzed serum. E2 (10−8 M) and U0126 (45 μM) (preincubation of 2 h) were added for 1 h (indicated by a +). A coimmunoprecipitation assay was performed using anti-ERα antibodies (top), and coprecipitated SRC-3 was detected by Western blotting using anti-SRC-3 antibodies (middle). Note that the ligand-induced SRC-3/ERα interaction is dramatically reduced in the presence of U0126. (H) HeLa cells were cotransfected with an ERα response element/luciferase reporter gene (150 ng/well) and expression plasmids for ERα (5 ng/well) and SRC-3 (150 ng/well). E2 (10−8 M) with or without U0126 (45 μM) was added to the transfected cells 24 h posttransfection and incubated for an additional 8 h. Cells were harvested, and luciferase activities were measured and normalized to protein amounts. Note that the ligand-induced SRC-3 transcriptional coactivation effect is diminished in the presence of U0126. Error bars represent SD. RLU, relative light units. (I) Inhibition of MAPK does not affect SRC-3 intrinsic transcriptional activation domains. HeLa cells were cotransfected with a UAS-TK luciferase reporter gene (150 ng/well) with or without an expression plasmid for Gal4-SRC-3 (50 ng/well). Cells were incubated for 24 h with or without U0126 (45 μM) and harvested, and luciferase activities were then measured and normalized against the total protein amount. Note that SRC-3 intrinsic transcriptional activation is not affected by the presence of U0126. Error bars represent SD.
FIG. 8.
FIG. 8.
Promoter recruitment of SRC-3 is abrogated in the presence of U0126. (A) The PRL array-HeLa cell line contains multiple genomic integrations of an ER element, which is spatially confined and visualized by the accumulation of fluorescently tagged ERα. (A) PRL-HeLa cells transiently expressing GFP-ER were treated with or without E2 (10 nM) (− or E2, respectively) for 30 min, fixed, and immunolabeled. Where indicated, cells were pretreated with U0126 (45 μM) for 2 h and then further incubated with E2 for 30 min (U0126/E2). Endogenous SRC-3 and SRC-1 were immunodetected with their respective antibodies (p160). A z series of focal planes was digitally imaged and deconvolved with the DeltaVision constrained iterative algorithm to generate high-resolution images. Arrows indicate the accumulation of ER or SRC-3/SRC-1 at the ER element integration site. Note that in contrast to SRC-1, the ligand-dependent recruitment of SRC-3 is inhibited by the presence of U0126. Bar, 2.5 μm. (B) Quantification of the colocalization pattern between p160 coactivators (SRC-3 or SRC-1) and ER at the PRL-promoter using the Pearson's colocalization coefficient [R(r)] (see Materials and Methods). The inset box shows examples of areas (i.e., transgene array) that were selected for calculation and the corresponding R(r) values.
FIG. 9.
FIG. 9.
SRC-3 phosphorylation is essential for recruitment at the promoter. (A) PRL-HeLa cells transiently coexpressing HcRed-ER and GFP-SRC-3 or GFP-SRC-3(A1-6) were treated with or without E2 (10 nM) (− or E2, respectively) for 30 min and then fixed and DAPI stained. A z series of focal planes was digitally imaged and deconvolved with the DeltaVision constrained iterative algorithm to generate high-resolution images. Arrows indicate the accumulation of ER or wild-type (WT) SRC-3 at the ER element integration site. Note that in contrast to SRC-3, the nonphosphorylatable mutant SRC-3(A1-6) is not corecruited with ER. (B) Quantitated graph of A. The histogram shows the proportion of the cotransfected cell population that has visible accumulation of both ER and SRC-3 [or SRC-3(A1-6)] at the array in response to E2 treatment (n > 100).
FIG. 10.
FIG. 10.
Phosphorylation life cycle of SRC-3 and probabilistic interactions. (A) The vast majority of SRC-3 is nuclear resident, but both the nuclear and cytoplasmic pools are dynamic. SRC-3 contains an NLS and an NES that regulate its import and export, respectively. External stimuli activate the cytoplasmic ERK signaling pathway, which in turn promotes SRC-3 phosphorylation. This results in an increase in the kinetics of import and the nuclear concentration of SRC-3 where it exhibits rapid molecular dynamics. (B) Phosphorylated SRC-3 has a high-affinity interaction with ERα and other coregulators (e.g., CBP, CARM1, and P/CAF) in the nucleoplasm. These interactions lead to a reduced mobility and the formation of random and transient foci, which are generally not associated with transcription sites based strictly upon three-dimensional probabilities. (C) When dynamically bound to chromatin (63), ERα can specifically interact with phosphorylated SRC-3, which recruits other members of the chromatin remodeling machinery to initiate transcriptional activation. Phosphorylation-driven equilibria increase the probability of forming transient complexes at a target gene and are critical to ERα-regulated gene expression. ERE, ER element; kOFF, constant of dissociation of the ER at the promoter.

Similar articles

Cited by

References

    1. Amazit, L., Y. Alj, R. K. Tyagi, A. Chauchereau, H. Loosfelt, C. Pichon, J. Pantel, E. Foulon-Guinchard, P. Leclerc, E. Milgrom, and A. Guiochon-Mantel. 2003. Subcellular localization and mechanisms of nucleocytoplasmic trafficking of steroid receptor coactivator-1. J. Biol. Chem. 278:32195-32203. - PubMed
    1. Anzick, S. L., J. Kononen, R. L. Walker, D. O. Azorsa, M. M. Tanner, X. Y. Guan, G. Sauter, O. P. Kallioniemi, J. M. Trent, and P. S. Meltzer. 1997. AIB1, a steroid receptor coactivator amplified in breast and ovarian cancer. Science 277:965-968. - PubMed
    1. Arimura, A., M. van Peer, A. J. Schroder, and P. B. Rothman. 2004. The transcriptional co-activator p/CIP (NCoA-3) is up-regulated by STAT6 and serves as a positive regulator of transcriptional activation by STAT6. J. Biol. Chem. 279:31105-31112. - PubMed
    1. Avivar, A., M. C. Garcia-Macias, E. Ascaso, G. Herrera, J. E. O'Connor, and J. F. de Mora. 2006. Moderate overexpression of AIB1 triggers pre-neoplastic changes in mammary epithelium. FEBS Lett. 580:5222-5226. - PubMed
    1. Baumann, C. T., H. Ma, R. Wolford, J. C. Reyes, P. Maruvada, C. Lim, P. M. Yen, M. R. Stallcup, and G. L. Hager. 2001. The glucocorticoid receptor interacting protein 1 (GRIP1) localizes in discrete nuclear foci that associate with ND10 bodies and are enriched in components of the 26S proteasome. Mol. Endocrinol. 15:485-500. - PubMed

Publication types

MeSH terms

LinkOut - more resources