. 2007 Oct;18(10):3741-51.
doi: 10.1091/mbc.e06-12-1125. Epub 2007 Jul 18.

p180 is involved in the interaction between the endoplasmic reticulum and microtubules through a novel microtubule-binding and bundling domain

Affiliations

p180 is involved in the interaction between the endoplasmic reticulum and microtubules through a novel microtubule-binding and bundling domain

Kiyoko Ogawa-Goto et al. Mol Biol Cell. 2007 Oct.

Abstract

p180 was originally reported as a ribosome-binding protein on the rough endoplasmic reticulum membrane, although its precise role in animal cells has not yet been elucidated. Here, we characterized a new function of human p180 as a microtubule-binding and -modulating protein. Overexpression of p180 in mammalian cells induced an elongated morphology and enhanced acetylated microtubules. Consistently, electron microscopic analysis clearly revealed microtubule bundles in p180-overexpressing cells. Targeted depletion of endogenous p180 by small interfering RNAs led to aberrant patterns of microtubules and endoplasmic reticulum in mammalian cells, suggesting a specific interaction between p180 and microtubules. In vitro sedimentation assays using recombinant polypeptides revealed that p180 bound to microtubules directly and possessed a novel microtubule-binding domain (designated MTB-1). MTB-1 consists of a predicted coiled-coil region and repeat domain, and strongly promoted bundle formation both in vitro and in vivo when expressed alone. Overexpression of p180 induced acetylated microtubules in cultured cells in an MTB-1-dependent manner. Thus, our data suggest that p180 mediates interactions between the endoplasmic reticulum and microtubules mainly through the novel microtubule-binding and -bundling domain MTB-1.


Figures

Figure 1.
Figure 1.
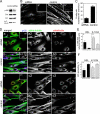
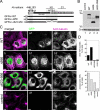
Increased acetylation of MTs in p180 transfectants. (A) CHO transfectants expressing human p180 (b and c) or control line cells (a) were fixed and stained for acetylated tubulin (a–c) and p180 (a′–c′). Bars, 25 μm. Typical images of two transfectants (clones 5e and 34j) and one control cell line (clone Z3) at 5 h after plating are shown. (B) Western blotting analysis of acetylated tubulin in p180 transfectants (lanes 1 and 2), control line cells (lanes 3 and 4), and parental CHO cells (lane 5). The levels of acetylated tubulin were estimated by densitometric scanning and normalized by the corresponding levels of β-actin. The transfectants contain ∼1.71 ± 0.1-fold (mean ± SD, n = 6) higher levels of acetylated tubulin compared with parental CHO cells, whereas the levels in control line cells are not significantly increased (1.14 ± 0.09-fold, mean ± SD, n = 3). (C) Electron microscopic image of a p180-transfectant (clone 34f) demonstrating lateral alignment of densely packed MTs. Bar, 250 nm. (D) Membrane fractions were prepared from the p180 transfectants and analyzed by Western blotting. p180 cosediments with the membrane fraction, but is not detected in the soluble fraction. Lane 1, total cell lysate; lane 2, membrane fraction; lane 3, soluble fraction. β-actin and ribophorin II were used as cytosolic and membrane protein markers, respectively. (E) CHO cells were transected with pcDNAp180-54R, fixed at 24 h after transfection and double-stained for p180 (right) and acetylated tubulin (left). Transient p180 overexpression leads to an elongated morphology and heavily enhanced bundles of acetylated MTs. Bars, 20 μm.
Figure 2.
Figure 2.
Effects of p180 depletion on the ER and MT pattern. (A) HEL cells were transfected with a p180-targeting siRNA and analyzed at 3 d after transfection by Western blotting and densitometry. The level of p180 is reduced to <30% of the level in control cells, whereas the expression levels of other ER markers, Cnx and Crt, are not markedly reduced. The level of acetylated tubulin is reduced to ∼55% of the level in control cells. (B) Control (b) or siRNA-transfected (a) HEL cells were fixed at 72 h after transfection and stained for acetylated tubulin (a and b) and p180 (a′ and b′). Control cells transfected with a nonsilencing siRNA contain well-developed acetylated MT bundles, whereas p180-depleted cells display immature acetylated MTs. (C) The numbers of cells carrying acetylated MT bundles were counted and expressed as percentages of the total number of p180-depleted or control cells. Cells containing acetylated MT bundles were defined as cells in which the acetylated MT bundles were ≥3-fold longer than the length of the nuclear long axis. Data represent the means ± SD of three separate experiments. (D) Control (b and d) or siRNA-transfected (a and c) cells were fixed at 72 h after transfection and stained for α-tubulin (green), Crt (red), and p180 (blue). In most of the control HEL (b) and K-1034 (d) cells, MTs are organized in parallel arrays (b2 and d2). In contrast, p180-depleted cells (a and c) show aberrant MT organization (a2 and c2). Typical cells displaying radial or nonparallel MTs are shown in panel a, except for a nondepleted cell shown by a small arrow. (E) The numbers of cells displaying radial or nonparallel MTs were counted and expressed as percentages of the total number of p180-depleted or control cells. a, HEL cells; b, K-1034 cells. For this assay, intermediate phenotypes containing a partially parallel pattern were not categorized as radial or nonparallel MTs. Data represent the means ± SD of three separate experiments. (F) The ER area per cell was measured as described in Materials and Methods and expressed as the percentage of the ER area of control cells. a, HEL cells; b, K-1034 cells. Data represent the means ± SD of three separate experiments.
Figure 3.
Figure 3.
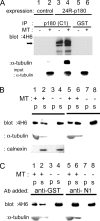
Full-length p180 binds to taxol-stabilized MTs in vitro. (A) Bacterially expressed 24R-p180 (lanes 3–6) or control samples (lanes 1 and 2) were captured by protein A–conjugated magnetic beads using an anti-p180 antibody (lanes 1–4) and incubated in the presence (lanes 2, 4, and 6) or absence (lanes 1, 3, and 5) of MTs. After extensive washing, the samples were analyzed by Western blotting with mAb 4H6 (top panel) or an anti-tubulin antibody (middle). The input tubulin before washing is shown at the bottom. IP, immunoprecipitate. (B) Detergent-extracted HEL cell lysates were incubated with (lanes 1, 2, 5, and 6) or without (lanes 3, 4, 7, and 8) MTs that had been in vitro–polymerized and taxol-stabilized. After a brief centrifugation, the samples were analyzed by Western blotting. In the presence of MTs, endogenous p180 in the HEL cell lysates cosediments with MTs and is detected in the pellet (p) fractions, whereas in the absence of MTs, p180 remains in the supernatant (s) fractions. The final concentration of NaCl was adjusted to 120 mM (lanes 1–4) or 200 mM (lanes 5–8). Cnx was blotted as a nonsedimented control using the same PVDF membrane. (C) Detergent extracts of HEL cells were treated with 2 μg of an anti-N1 or anti-GST antibody for 30 min, and then taxol-stabilized MTs were added and analyzed as described for B. Addition of the anti-N1 antibody (lane 5), but not the anti-GST antibody (lane 1), disturbs the binding of p180 to MTs.
Figure 4.
Figure 4.
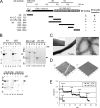
Binding of truncated p180 polypeptides to MTs in vitro. (A) Schematic representations of full-length and truncated constructs of various regions of p180. Human p180 has a predicted transmembrane domain (TM) close to the N-terminus, a highly basic N-terminal domain consisting of lysine clusters (hatched boxes), a basic tandem repeat domain (solid box), and a C-terminal acidic coiled-coil domain comprised of 15 predicted segments (gray boxes; Langley et al., 1998). The numbers on the left of each truncated mutant denote the amino acid residue numbers of human p180 (DDBJ accession number: AB287347). A summary of the in vitro binding assay data is shown on the right. The epitopes of the antibodies used in this study are shown at the top. (B) The recombinant polypeptides were incubated for 30 min at room temperature in the absence (−) or presence (+) of MTs and then centrifuged on a sucrose cushion. Lanes 1–24, Coomassie brilliant blue staining patterns of GST-tagged proteins (lanes 1–16) and His-tagged proteins (lanes 17–24). N1, N1ΔRp, and 25–157 cosediment with MTs. The large arrows indicate the position of tubulin. Molecular markers are shown on the left. P, pellet; S, supernatant. For the assays for N1ΔRp and N1ΔC, we used (His)6-tagged polypeptides, because GST-tagged N1ΔRp was extremely unstable at neutral pH under the assay conditions. (C) Negatively stained electron micrographs of taxol-stabilized MTs mixed with N1 (left) and GST (right). Bars, 500 nm. A higher-magnification micrograph of N1 (inset) shows laterally aligned MTs. Bar, 200 nm. (D) Atomic force microscopic images of taxol-stabilized MTs with N1 (left) and GST (right). (E) Taxol-stabilized MTs were incubated with N1 or GST for 30 min. Subsequently, various concentrations of calcium (final concentrations: 0.1–100 mM) were added and briefly mixed at each point shown by the arrows, before the OD at 350 nm was monitored.
Figure 5.
Figure 5.
Dimer formation by the MTB-1 domain. (A) The dimerization capacities of purified His-N1 (lanes 1 and 2), His-N1ΔRp (lanes 3 and 4), and His-N1ΔC (lanes 5 and 6) were examined by chemical cross-linking, because the N1 domain does not contain any cysteine residues. Lanes 1, 3, and 5, in the absence of DMP; lanes 2, 4 and 6, in the presence of DMP. Each polypeptide was separated by SDS-PAGE and stained with Coomassie brilliant blue. Molecular markers are shown on the left.
Figure 6.
Figure 6.
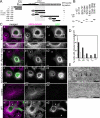
Overexpression of the MTB-1 domain induces MT bundles in vivo. (A) Schema representing wild-type p180 and various GFP-tagged mutants. A summary of the results from transient transfection experiments in COS-1 cells is shown on the right. The regions of MTB-1 and MTB-2 are shown at the top. In these constructs, the GFP sequence was mutated to avoid self-dimerization. (B) At 16–18 h after transfection, the different GFP-tagged mutants expressed in COS-1 cells were blotted with an anti-GFP antibody. (C) COS-1 cells were transfected with the GFP-tagged mutants or WT p180. (a) GFP-N1; (b) GFP-N1ΔRp; (c) GFP-N1ΔC; (d) nontransfected cells; (e) GFPer-WT. After 18–20 h, the cells were fixed and stained for α-tubulin (a1–e1). An enlarged image of the boxed region in panel a is shown in a′. Cells marked with asterisks are nontransfected cells. Bars, 10 μm. (D) Fluorescence images were captured, and cells displaying circular MTs (■) or bundled MTs (□) were counted. A typical example of cells displaying circular MTs is shown in Figure S2c, whereas a typical example of bundled MTs is shown in Figure S2b. Data are expressed as percentages of the total number of GFP-expressing cells and represent the means of two separate experiments. (E) COS-1 cells were transfected with GFP-N1, fixed at 16 h after transfection, and subjected to TEM analysis. In the perinuclear region of these cells, laterally coaligned MTs (arrows in top panel) are observed, which overlap with undefined high-density structures. Loose and twisted MT bundles can also be seen around the structures (bottom). Bars, 250 nm.
Figure 7.
Figure 7.
Acetylated MT patterns after overexpression of WT and mutant p180s. (A) Schema representing WT p180 and expression constructs for GFP-tagged mutants of p180. The regions of MTB-1 and -2 are shown by hatched boxes. S, signal sequence. The epitopes of the antibodies used in this study are shown at the top. (B) COS-1 cells were mock-transfected (lane 1) or transfected with GFPer-WT (lane 2), GFPer-Δ956 (lane 3), or GFPer-Δ623–956 (lane 4). At 48 h after transfection, a Western blotting analysis was performed using mAb 4H6. Cnx was used as a loading control. (C) Immunofluorescence images of cells transfected with (a) GFPer-WT, (b) GFPer-Δ956, or (c) GFPer-Δ623–956, as well as nontransfected cells (d). a1–d1, GFP signals; a2–d2, acetylated tubulin staining. Merged signals are shown on the left. Bars, 10 μm. (D) Cells displaying bundles of acetylated MTs (top) and circular acetylated MTs (bottom) were counted as described for Figure 6D. Data are expressed as percentages of the cells expressing high levels of GFP and represent the means of two separate experiments.

Similar articles

Cited by

References

    1. Allan V. J., Schroer T. A. Membrane motors. Curr. Opin. Cell Biol. 1999;11:476–482. - PubMed
    1. Andrade J., Zhao H., Titus B., Timm Pearce S., Barroso M. The EF-hand Ca2+-binding protein p22 plays a role in microtubule and endoplasmic reticulum organization and dynamics with distinct Ca2+-binding requirements. Mol. Biol. Cell. 2004;15:481–496. Epub 2003 Dec 2002. - PMC - PubMed
    1. Baumann O., Walz B. Endoplasmic reticulum of animal cells and its organization into structural and functional domains. Int. Rev. Cytol. 2001;205:149–214. - PubMed
    1. Becker F., Block-Alper L., Nakamura G., Harada J., Wittrup K. D., Meyer D. I. Expression of the 180-kD ribosome receptor induces membrane proliferation and increased secretory activity in yeast. J. Cell Biol. 1999;146:273–284. - PMC - PubMed
    1. Bulinski J. C., Gundersen G. G. Stabilization of post-translational modification of microtubules during cellular morphogenesis. Bioessays. 1991;13:285–293. - PubMed

MeSH terms

LinkOut - more resources