

A public T cell clonotype within a heterogeneous autoreactive repertoire is dominant in driving EAE
- PMID: 17627303
- PMCID: PMC1906731
- DOI: 10.1172/JCI28277
A public T cell clonotype within a heterogeneous autoreactive repertoire is dominant in driving EAE
Abstract
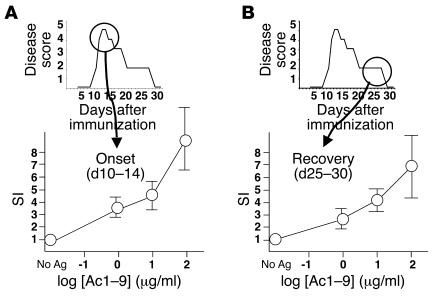
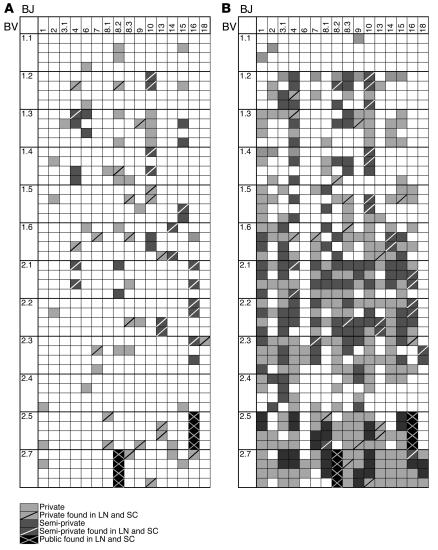
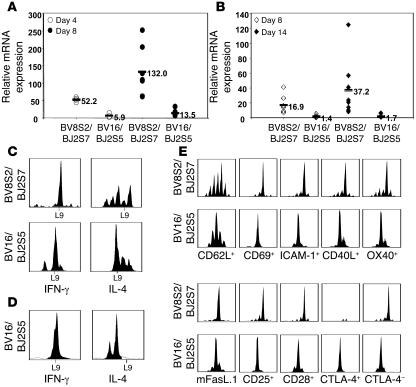
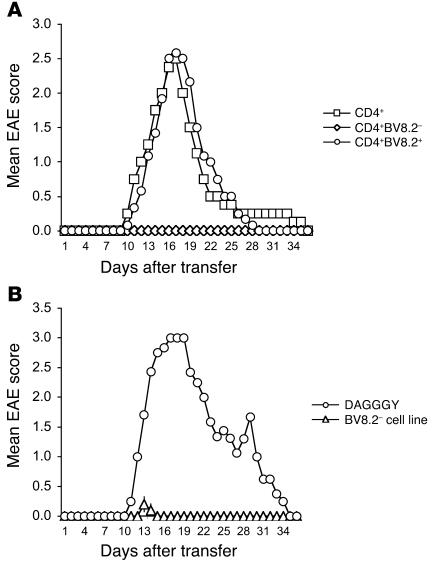
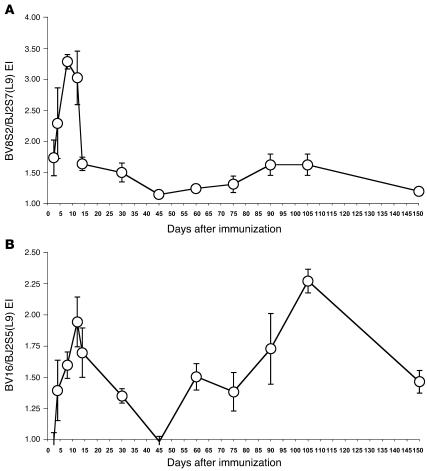
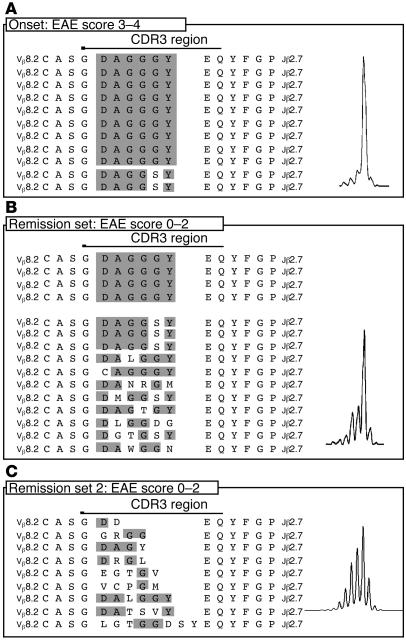
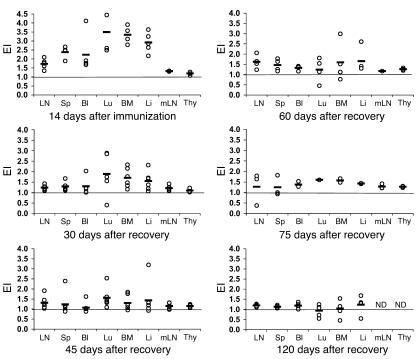
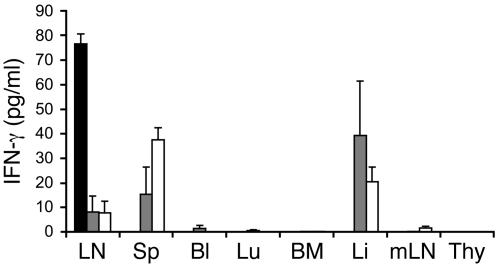
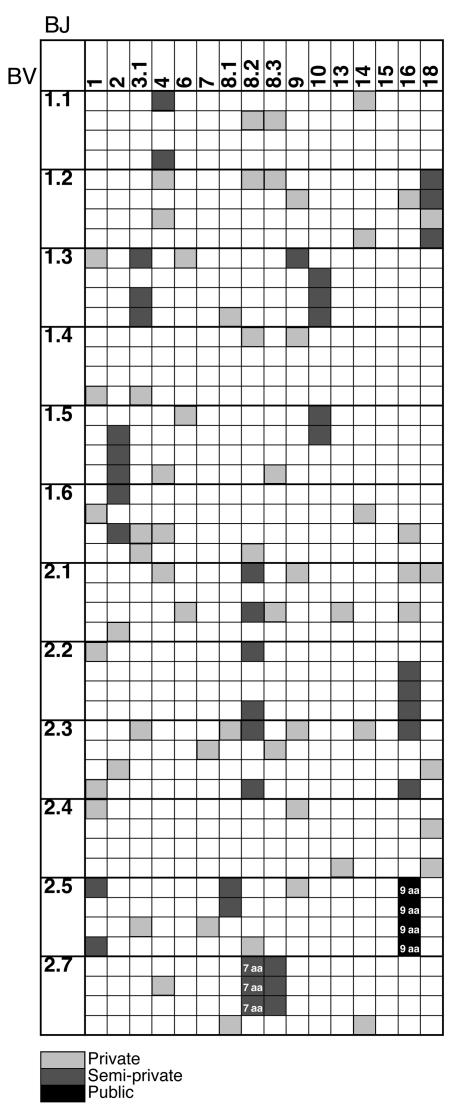
Experimental autoimmune encephalomyelitis (EAE) is an animal model of multiple sclerosis. Immunization of B10.PL mice with the Ac1-9 peptide, the immunodominant determinant of myelin basic protein (MBP), produced a single episode of EAE followed by recovery and resistance to reinduction of disease. Using the CDR3 length spectratyping technique, we characterized the clonal composition of the Ac1-9-specific T cell repertoire from induction through onset and resolution of disease. Two clonally restricted subsets within a heterogeneous self-reactive repertoire were found in mouse lymph nodes, spleen, and spinal cord soon after immunization, before any sign of EAE. These clonotypes, designated BV8S2/BJ2S7 and BV16/BJ2S5, were present in all mice examined and thus considered public. BV8S2/BJ2S7 was found in far greater excess; was exclusively Th1 polarized; disappeared from the spinal cord, spleen, and lymph nodes concomitantly with recovery; and transferred disease to naive recipients. In contrast, BV16/BJ2S5 and numerous private clonotypes were either Th1 or Th2 and persisted following recovery. These results are consistent with the hypothesis that the public clonotype BV8S2/BJ2S7 is a driver of disease and necessary for its propagation.
Figures
Similar articles
-
Tracking of V beta 8.2-positive encephalitogenic T cells by complementarity-determining region 3 spectratyping and subsequent Southern blot hybridization in Lewis rats after neuroantigen sensitization.J Immunol. 2004 Oct 1;173(7):4516-22. doi: 10.4049/jimmunol.173.7.4516. J Immunol. 2004. PMID: 15383583
-
Endogenous CD4+BV8S2- T cells from TG BV8S2+ donors confer complete protection against spontaneous experimental encephalomyelitis (Sp-EAE) in TCR transgenic, RAG-/- mice.J Neurosci Res. 2003 Jan 1;71(1):89-103. doi: 10.1002/jnr.10450. J Neurosci Res. 2003. PMID: 12478617
-
Presentation of the self antigen myelin basic protein by dendritic cells leads to experimental autoimmune encephalomyelitis.J Immunol. 1999 Jul 1;163(1):32-9. J Immunol. 1999. PMID: 10384096
-
Effects of vaccination with T cell receptor peptides: epitope switching to a possible disease-protective determinant of myelin basic protein that is cross-reactive with a TCR BV peptide.Immunol Cell Biol. 1998 Feb;76(1):83-90. doi: 10.1046/j.1440-1711.1998.00720.x. Immunol Cell Biol. 1998. PMID: 9553780 Review.
-
[Mechanisms involved in the regulation of immune response in experimental autoimmune encephalomyelitis in mice].Postepy Hig Med Dosw (Online). 2006;60:571-83. Postepy Hig Med Dosw (Online). 2006. PMID: 17115007 Review. Polish.
Cited by
-
Activation pathways that drive CD4+ T cells to break tolerance in autoimmune diseases.Immunol Rev. 2022 May;307(1):161-190. doi: 10.1111/imr.13071. Epub 2022 Feb 10. Immunol Rev. 2022. PMID: 35142369 Free PMC article. Review.
-
Molecular mimics can induce a nonautoaggressive repertoire that preempts induction of autoimmunity.Proc Natl Acad Sci U S A. 2010 Feb 9;107(6):2550-5. doi: 10.1073/pnas.0914508107. Epub 2010 Jan 20. Proc Natl Acad Sci U S A. 2010. PMID: 20133742 Free PMC article.
-
A T cell-binding fragment of fibrinogen can prevent autoimmunity.J Autoimmun. 2010 Jun;34(4):453-9. doi: 10.1016/j.jaut.2009.11.017. Epub 2009 Dec 24. J Autoimmun. 2010. PMID: 20036106 Free PMC article.
-
Haematopoietic Stem Cell Transplantation Results in Extensive Remodelling of the Clonal T Cell Repertoire in Multiple Sclerosis.Front Immunol. 2022 Feb 7;13:798300. doi: 10.3389/fimmu.2022.798300. eCollection 2022. Front Immunol. 2022. PMID: 35197974 Free PMC article.
-
Matrix metalloproteinase proteolysis of the myelin basic protein isoforms is a source of immunogenic peptides in autoimmune multiple sclerosis.PLoS One. 2009;4(3):e4952. doi: 10.1371/journal.pone.0004952. Epub 2009 Mar 20. PLoS One. 2009. PMID: 19300513 Free PMC article.
References
-
- Jingwu Z., et al. Myelin basic protein-specific T lymphocytes in multiple sclerosis and controls: precursor frequency, fine specificity, and cytotoxicity. Ann. Neurol. 1992;32:330–338. - PubMed
Publication types
MeSH terms
Substances
Grants and funding
LinkOut - more resources
Full Text Sources
Other Literature Sources
Medical
Molecular Biology Databases
Miscellaneous
