. 2007 Sep 14;282(37):26687-26695.
doi: 10.1074/jbc.M704165200. Epub 2007 Jul 10.

Tissue-specific expression of betaKlotho and fibroblast growth factor (FGF) receptor isoforms determines metabolic activity of FGF19 and FGF21

Affiliations

Tissue-specific expression of betaKlotho and fibroblast growth factor (FGF) receptor isoforms determines metabolic activity of FGF19 and FGF21

Hiroshi Kurosu et al. J Biol Chem. .

Abstract

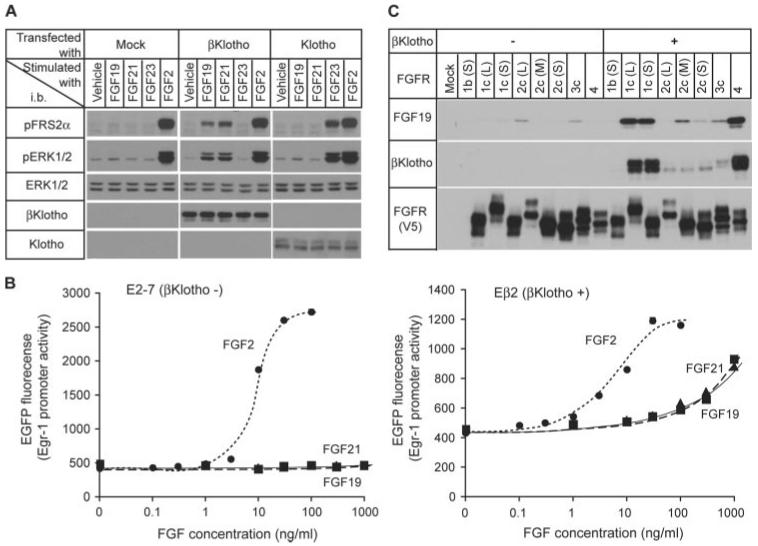
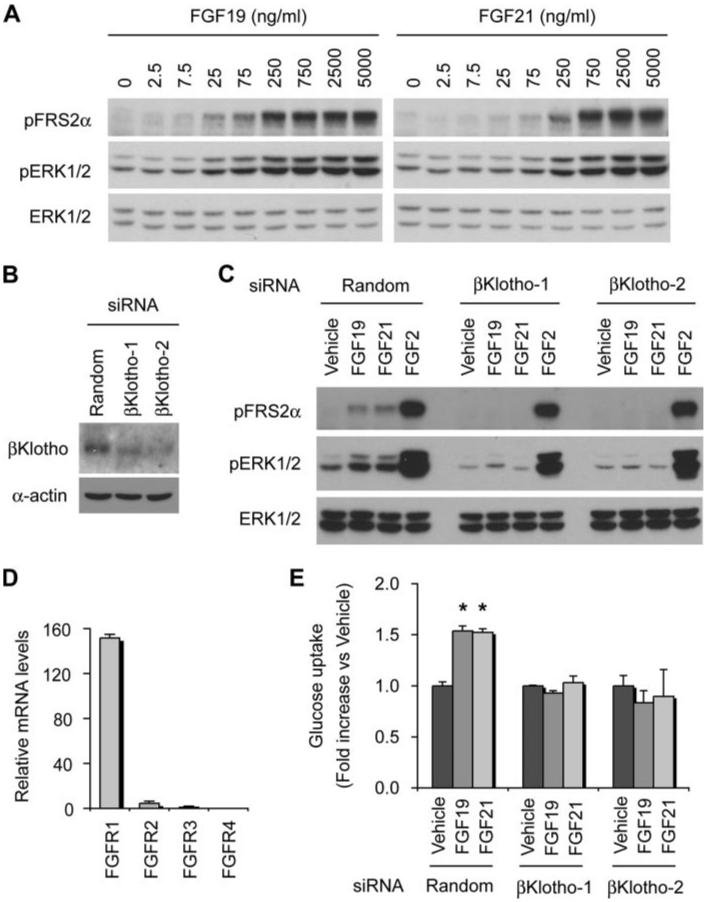
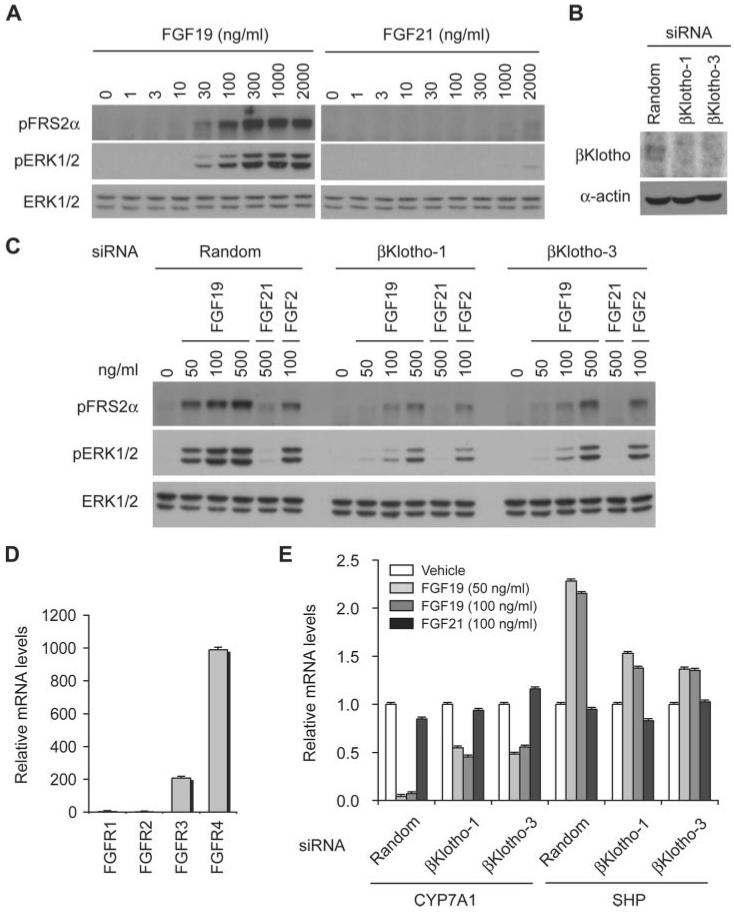
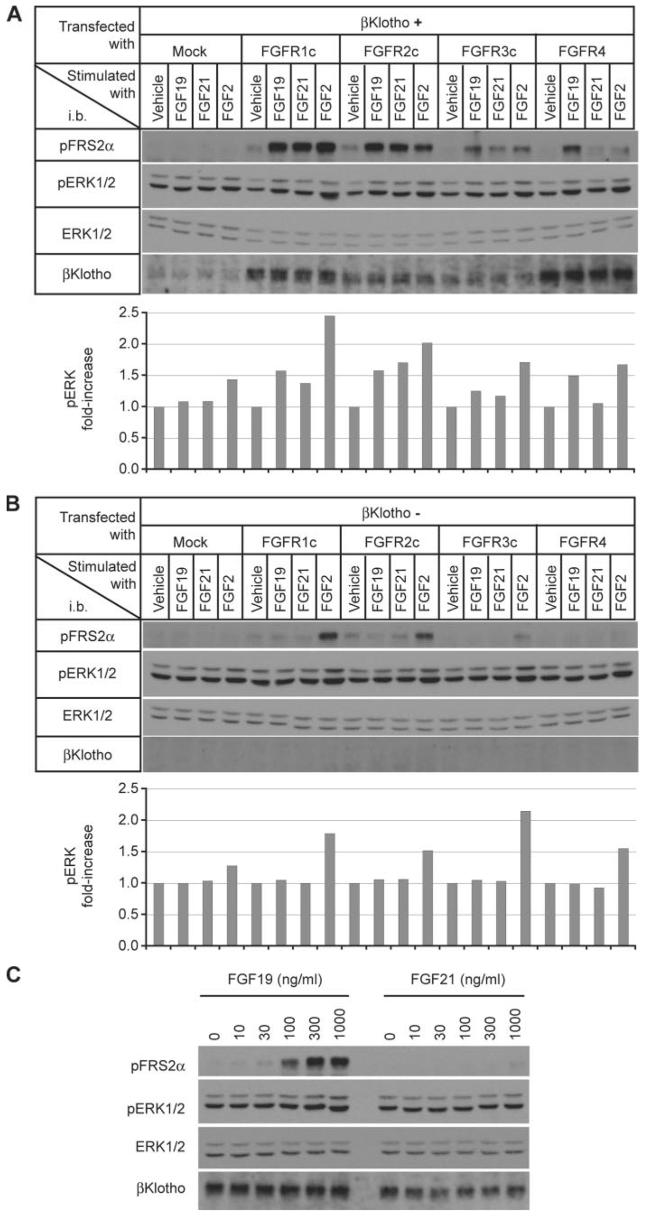
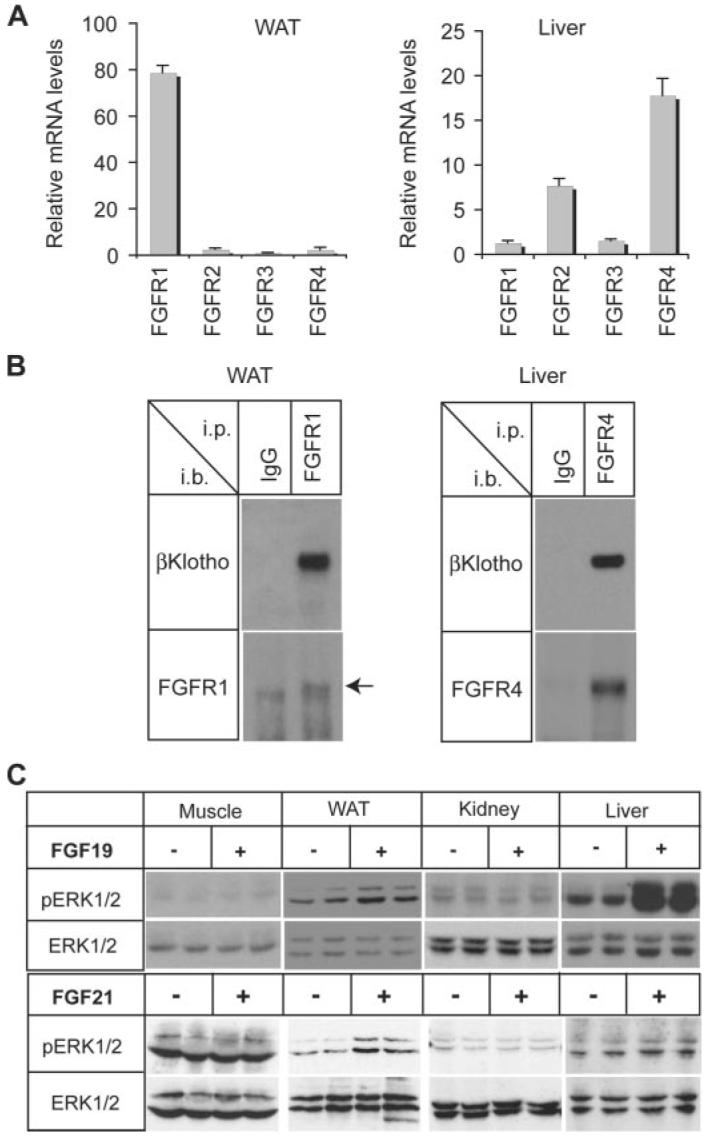
The fibroblast growth factor (FGF) 19 subfamily of ligands, FGF19, FGF21, and FGF23, function as hormones that regulate bile acid, fatty acid, glucose, and phosphate metabolism in target organs through activating FGF receptors (FGFR1-4). We demonstrated that Klotho and betaKlotho, homologous single-pass transmembrane proteins that bind to FGFRs, are required for metabolic activity of FGF23 and FGF21, respectively. Here we show that, like FGF21, FGF19 also requires betaKlotho. Both FGF19 and FGF21 can signal through FGFR1-3 bound by betaKlotho and increase glucose uptake in adipocytes expressing FGFR1. Additionally, both FGF19 and FGF21 bind to the betaKlotho-FGFR4 complex; however, only FGF19 signals efficiently through FGFR4. Accordingly, FGF19, but not FGF21, activates FGF signaling in hepatocytes that primarily express FGFR4 and reduces transcription of CYP7A1 that encodes the rate-limiting enzyme for bile acid synthesis. We conclude that the expression of betaKlotho, in combination with particular FGFR isoforms, determines the tissue-specific metabolic activities of FGF19 and FGF21.


Figures

FIGURE 1
FIGURE 1. FGF19 requires βKlotho for strong binding to FGFR and robust activation of FGF signaling
A, forced expression of βKlotho confers responsiveness to FGF19 on HEK293 cells. HEK293 cells were transfected with either mock vector (Mock) or expression vectors for βKlotho and Klotho, respectively, and then stimulated with vehicle, FGF19 (1,000 ng/ml), FGF21 (1,000 ng/ml), FGF23 (300 ng/ml), or FGF2 (100 ng/ml) for 10 min. The cell lysates were subjected to immunoblotting (i.b.) with antibodies against phosphorylated FRS2α (pFRS2α), phosphorylated ERK1/2 (pERK1/2), total ERK1/2 (ERK1/2), βKlotho, or Klotho. A representative result from more than 10 independent experiments is shown. B, dose-dependent activation of Egr-1 promoter with FGF2 (●), FGF19 (▲), and FGF21 (■) in E2-7 cells (HEK293 cells stably transfected with a reporter plasmid containing human Egr-1 promoter and enhanced green fluorescent protein, left panel) and in Eβ2 cells (E2-7 cells stably transfected with a βKlotho expression vector, right panel). The assays were performed in triplicate. C, FGF19 binds to βKlotho-FGFR complexes more efficiently than to FGFR alone. HEK293 cells were transfected with one of the indicated FGFR isoforms (with a V5 tag) alone or with βKlotho. FGFR or FGFR-βKlotho complex were immunoprecipitated from cell lysates on agarose beads carrying an anti-V5 antibody. The beads were then incubated with FGF19, and bead-bound proteins were analyzed by immunoblotting for the presence of βKlotho, FGF19, and FGFR (V5). The difference between b and c isoforms in FGFR13 resides in the C-terminal half of the third immunoglobulin-like domain. Another alternative splicing event occurs within the first immunoglobulin- like domain and acidic box, which generates long (L), middle (M), and short isoforms (S) in FGFR1 and FGFR2. See supplemental Fig. S1 for details.
FIGURE 2
FIGURE 2. Both FGF19 and FGF21 activate FGF signaling and increase glucose uptake in adipocytes
A, dose response of FGF19 and FGF21 signaling in 3T3-L1 adipocytes. The activity of FGF signaling was determined by immunoblot analysis of phosphorylated FRS2α (pFRS2α) and phosphorylated ERK1/2 (pERK1/2) with total ERK1/2 (ERK1/2) used as an internal control. B, knock-down of βKlotho expression by siRNA. 3T3-L1 adipocytes were transfected with a nontargeting random siRNA (Random) or two independent mouse βKlotho siRNAs (βKlotho-1 and βKlotho-2). Expression of βKlotho, with α-actin used as a loading control, was determined by immunoblotting. C, both FGF19 and FGF21 require endogenous βKlotho to activate FGF signaling in adipocytes. 3T3-L1 adipocytes were transfected with a nontargeting random siRNA (Random) or two independent mouse βKlotho siRNAs (βKlotho-1 and βKlotho-2) and then stimulated with FGF19 (1,000 ng/ml), FGF21 (1,000 ng/ml), or FGF2 (100 ng/ml) for 10 min and subjected to immunoblot analysis as in A. D, 3T3-L1 adipocytes predominantly express FGFR1. FGFR1–4 mRNA levels were measured by quantitative RT-PCR in triplicates using the comparative CT method and indicated as the relative fold difference from the lowest expression level of FGFR. The bars indicate means plus S.D. error (n = 3). E, both FGF19 and FGF21 increase glucose uptake in adipocytes in a βKlotho-dependent manner. 3T3-L1 adipocytes were transfected with siRNA as in B and then assayed for glucose uptake after incubation with either vehicle, FGF19 (1,000 ng/ml), or FGF21 (1,000 ng/ml) for 18 h. The results are shown as the means plus S.D. (error bars, n = 3). *, p < 0.05 versus vehicle by Student's t test.
FIGURE 3
FIGURE 3. FGF19, but not FGF21, activates FGF signaling and suppresses CYP7A1 expression in hepatocytes
A, dose response of FGF19 and FGF21 signaling in H4IIE hepatocytes. The activity of FGF signaling was determined by immunoblot analysis for phosphorylated FRS2α (pFRS2α) and phosphorylated ERK1/2 (pERK1/2), with total ERK1/2 (ERK1/2) levels serving as an internal control. B, knock-down of βKlotho expression by siRNA. H4IIE cells were transfected with a nontargeting random siRNA (Random) or two independent rat βKlotho siRNAs (βKlotho-1 and βKlotho-3). Expression of βKlotho, and α-actin as a loading control, was determined by immunoblotting. C, FGF19 requires endogenous βKlotho to activate FGF signaling in hepatocytes. H4IIE cells were transfected with a nontargeting random siRNA (Random) or two independent βKlotho siRNAs (βKlotho-1 and βKlotho-3) and stimulated with FGF19, FGF21, or FGF2 at the indicated concentrations for 10 min, and the cell lysates were subjected to immunoblot analysis as in A. D, H4IIE cells predominantly express FGFR4. FGFR1–4 mRNA levels were measured by quantitative RT-PCR in triplicate using the comparative CT method and indicated as the relative fold difference from the lowest expression level of FGFR. The bars indicate the means plus S.D. error (n = 3). E, FGF19 suppresses CYP7A1 expression and increases SHP expression in hepatocytes in a βKlotho-dependent manner. H4IIE cells were transfected with siRNA as in B and then assayed for CYP7A1 and SHP mRNA levels after incubation with either vehicle, FGF19 (50 ng/ml or 100 ng/ml), or FGF21 (100 ng/ml) for 10 h. The results are presented as the relative fold difference from vehicle-treated samples. The bars indicate the means plus S.D. error (n = 3).
FIGURE 4
FIGURE 4. FGF19, but not FGF21, signals through the βKlotho-FGFR4 complex
A, L6 cells were cotransfected with expression vectors for βKlotho and one of the indicated FGFR isoforms, then stimulated with FGF19 (1,000 ng/ml), FGF21 (1,000 ng/ml), or FGF2 (100 ng/ml) for 10 min. FGF signaling activity was determined by immunoblot (i.b.) analysis for phosphorylated FRS2α (pFRS2α) and phosphorylated ERK1/2 (pERK1/2) and total ERK1/2 (ERK1/2) levels performed as an internal control (upper panel). The signal intensity of phosphorylated ERK1/2 was quantified, corrected with that of corresponding total ERK1/2, and indicated as fold increase from vehicle-treated samples in each FGFR group (lower panel). A representative result from three independent experiments is shown. B, as in A, except that βKlotho was not transfected. C, dose response of FGF19 and FGF21 signaling in L6 cells cotransfected with expression vectors for βKlotho and FGFR4. The cell lysates were subjected to immunoblot analysis as in A.
FIGURE 5
FIGURE 5. FGF19- and FGF21-dependent signaling in white adipose tissue and liver in vivo
A, tissue distribution of FGFRs. FGFR1–4 mRNA levels in white adipose tissue and liver from wild-type mice were measured by quantitative RT-PCR in triplicates using the comparative CT method and indicated as the relative fold difference from the lowest expression level of FGFR. The bars indicate the means plus S.D. error (n = 3). B, βKlotho constitutively binds to FGFR1 and FGFR4 in mouse tissues. Tissue lysates from white adipose tissue (WAT) and liver were immunoprecipitated (i.p.) with anti-FGFR1 antibody and anti-FGFR4 antibody, respectively, and immunoblotted (i.b.) with the same anti-FGFR antibody or anti-βKlotho antibody. Normal IgG was used instead of anti-FGFR antibody as a negative control. The arrow indicates the FGFR1 specific band. C, tissue-specific activation of FGF signaling by FGF19 and FGF21. Hind limb muscles (Muscle), white adipose tissue (WAT), kidney, and liver were excised from mice treated either with vehicle (n = 4), FGF19 (n = 2), or FGF21 (n = 2). Tissue lysates were prepared for immunoblot analysis using the antibodies indicated.

Similar articles

Cited by

References

    1. Itoh N, Ornitz DM. Trends Genet. 2004;20:563–569. - PubMed
    1. Inagaki T, Choi M, Moschetta A, Peng L, Cummins CL, McDonald JG, Luo G, Jones SA, Goodwin B, Richardson JA, Gerard RD, Repa JJ, Mangelsdorf DJ, Kliewer SA. Cell Metab. 2005;2:217–225. - PubMed
    1. Choi M, Moschetta A, Bookout AL, Peng L, Umetani M, Holmstrom SR, Suino-Powell K, Xu HE, Richardson JA, Gerard RD, Mangelsdorf DJ, Kliewer SA. Nat. Med. 2006;12:1253–1255. - PubMed
    1. Inagaki T, Dutchak P, Zhao G, Ding X, Gautron L, Parameswara V, Li Y, Goetz R, Mohammadi M, Esser V, Elmquist JK, Gerard RD, Burgess SC, Hammer RE, Mangelsdorf DJ, Kliewer SA. Cell Metab. 2007;5:415–425. - PubMed
    1. Badman MK, Pissios P, Kennedy AR, Koukos G, Flier JS, Maratos-Flier E. Cell Metab. 2007;5:426–437. - PubMed

Publication types