

Independent associations of insulin resistance with high whole-body intermuscular and low leg subcutaneous adipose tissue distribution in obese HIV-infected women
- PMID: 17616768
- PMCID: PMC2670485
- DOI: 10.1093/ajcn/86.1.100
Independent associations of insulin resistance with high whole-body intermuscular and low leg subcutaneous adipose tissue distribution in obese HIV-infected women
Abstract
Background: Obesity and insulin resistance are growing problems in HIV-positive (HIV+) women receiving highly active antiretroviral therapy (HAART).
Objective: The objective was to determine the contribution of adipose tissue (AT) enlargement and distribution to the presence of insulin resistance in obese HIV+ women.
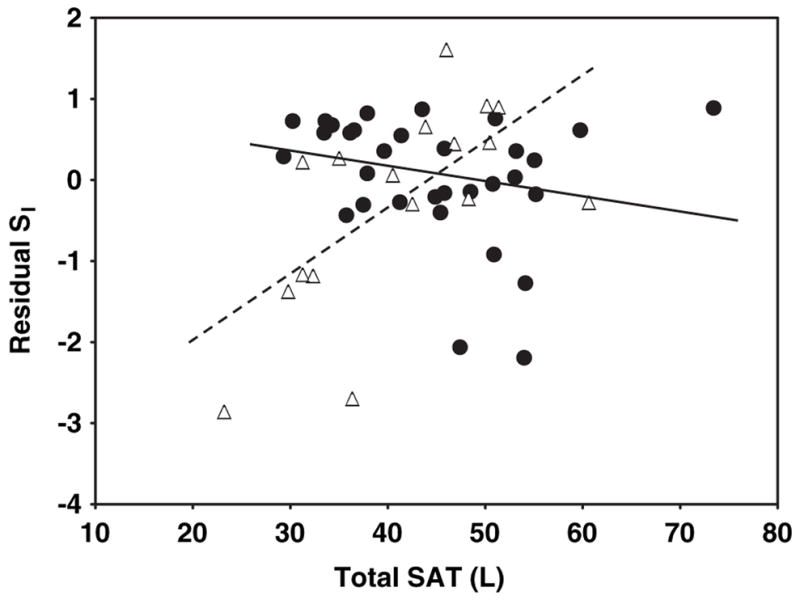
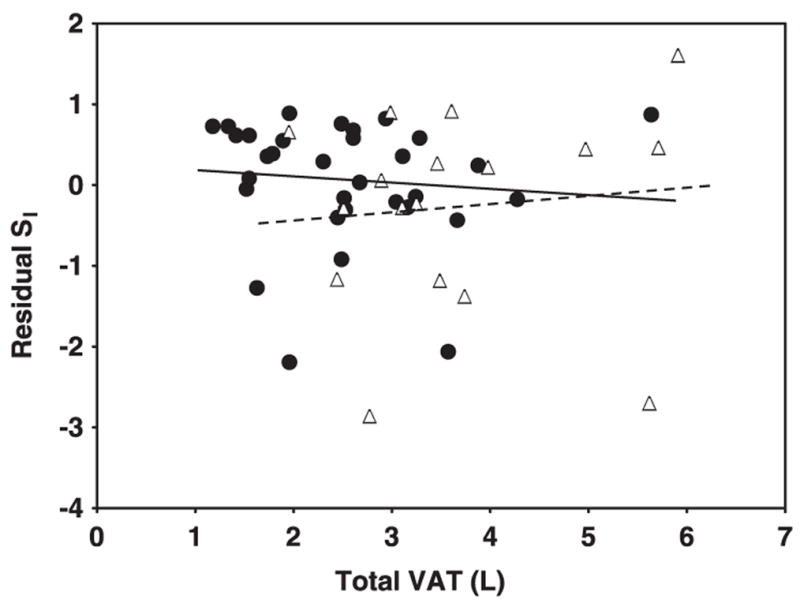
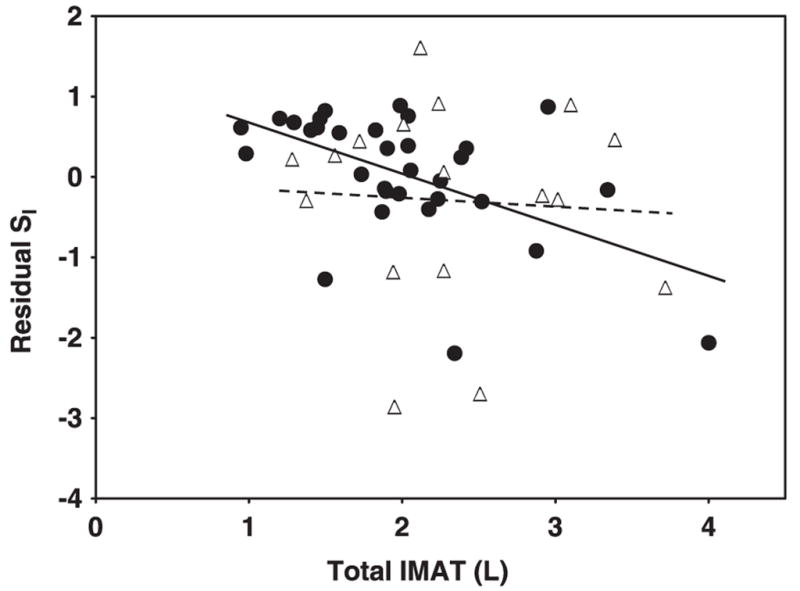
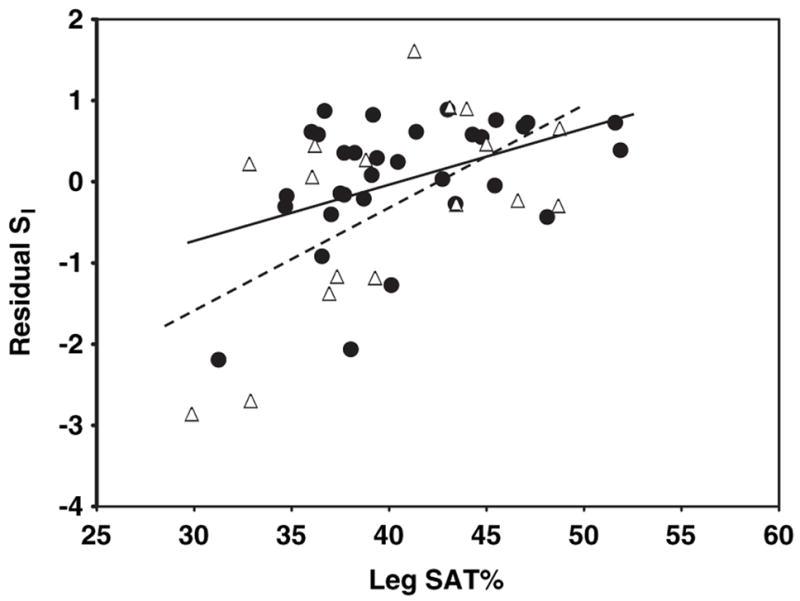
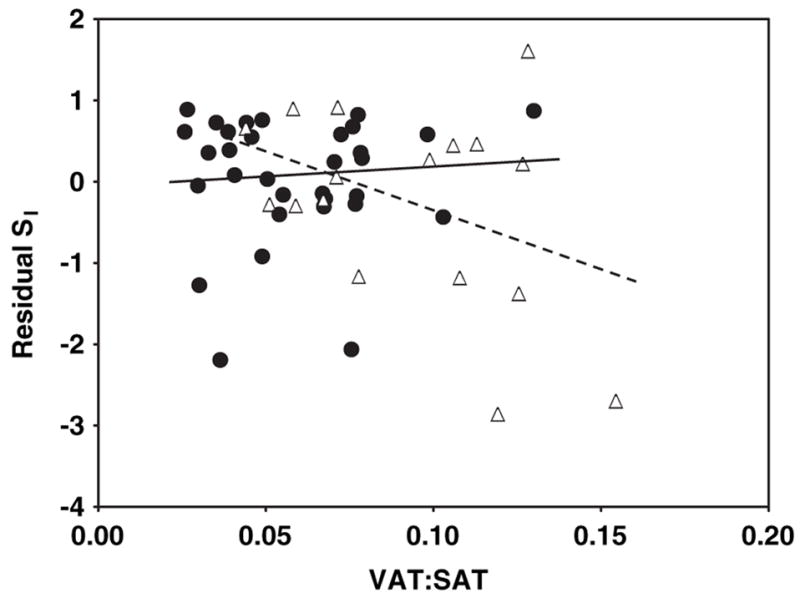
Design: Whole-body intermuscular AT (IMAT), visceral AT (VAT), subcutaneous AT (SAT), and SAT distribution (leg versus upper body) were measured by whole-body magnetic resonance imaging. Insulin sensitivity (S(I)) was measured with an intravenous glucose tolerance test in obese HIV+ women recruited because of their desire to lose weight (n=17) and in obese healthy controls (n=32).
Results: The HIV+ women had relatively less whole-body SAT and more VAT and IMAT than did the controls (P<0.05 for all). A significant interaction by HIV status was observed for the relation of total SAT with S(I) (P<0.001 for the regression's slope interactions after adjustment for age, height, and weight). However, relations of IMAT, VAT, and SAT distribution (leg SAT as a percentage of total SAT; leg SAT%) with S(I) did not differ significantly between groups. For both groups combined, the best model predicting a low S(I) included significant contributions by both high IMAT and low leg SAT%, independent of age, height, and weight, and no interaction between groups was observed (overall r(2)=0.44, P=0.0003).
Conclusion: In obese HIV+ women, high whole-body IMAT and low leg SAT% distribution are independently associated with insulin resistance.
Figures
Comment in
-
Adipose compartmentalization and insulin resistance among obese HIV-infected women: the role of intermuscular adipose tissue.Am J Clin Nutr. 2007 Jul;86(1):5-6. doi: 10.1093/ajcn/86.1.5. Am J Clin Nutr. 2007. PMID: 17616756 No abstract available.
Similar articles
-
Femoral-gluteal subcutaneous and intermuscular adipose tissues have independent and opposing relationships with CVD risk.J Appl Physiol (1985). 2008 Mar;104(3):700-7. doi: 10.1152/japplphysiol.01035.2007. Epub 2007 Dec 13. J Appl Physiol (1985). 2008. PMID: 18079271 Free PMC article.
-
Intermuscular adipose tissue and metabolic associations in HIV infection.Obesity (Silver Spring). 2011 Feb;19(2):283-91. doi: 10.1038/oby.2010.115. Epub 2010 Jun 10. Obesity (Silver Spring). 2011. PMID: 20539305 Free PMC article.
-
Insulin resistance, hepatic lipid and adipose tissue distribution in HIV-infected men.Antivir Ther. 2008;13(3):423-8. Antivir Ther. 2008. PMID: 18572755 Free PMC article.
-
Visceral adiposity and inflammatory bowel disease.Int J Colorectal Dis. 2021 Nov;36(11):2305-2319. doi: 10.1007/s00384-021-03968-w. Epub 2021 Jun 9. Int J Colorectal Dis. 2021. PMID: 34104989 Review.
-
Association between volume and glucose metabolism of abdominal adipose tissue in healthy population.Obes Res Clin Pract. 2017 Sep-Oct;11(5 Suppl 1):133-143. doi: 10.1016/j.orcp.2016.12.007. Epub 2017 Jan 7. Obes Res Clin Pract. 2017. PMID: 28073639 Review.
Cited by
-
Insulin sensitivity is associated with thigh adipose tissue distribution in healthy postmenopausal women.Metabolism. 2012 Dec;61(12):1817-23. doi: 10.1016/j.metabol.2012.05.016. Epub 2012 Jun 29. Metabolism. 2012. PMID: 22748969 Free PMC article.
-
Femoral-gluteal subcutaneous and intermuscular adipose tissues have independent and opposing relationships with CVD risk.J Appl Physiol (1985). 2008 Mar;104(3):700-7. doi: 10.1152/japplphysiol.01035.2007. Epub 2007 Dec 13. J Appl Physiol (1985). 2008. PMID: 18079271 Free PMC article.
-
Secondary diabetes mellitus in acromegaly.Endocrine. 2023 Jul;81(1):1-15. doi: 10.1007/s12020-023-03339-1. Epub 2023 Mar 8. Endocrine. 2023. PMID: 36882643 Free PMC article. Review.
-
Longitudinal changes in regional fat content in HIV-infected children and adolescents.AIDS. 2009 Jul 31;23(12):1501-9. doi: 10.1097/QAD.0b013e32832b7e69. AIDS. 2009. PMID: 19550288 Free PMC article.
-
Adipose Tissue Redistribution and Ectopic Lipid Deposition in Active Acromegaly and Effects of Surgical Treatment.J Clin Endocrinol Metab. 2015 Aug;100(8):2946-55. doi: 10.1210/jc.2015-1917. Epub 2015 Jun 2. J Clin Endocrinol Metab. 2015. PMID: 26037515 Free PMC article. Clinical Trial.
References
-
- Reaven GM. Role of insulin resistance in human disease. Diabetes. 1988;37:1595–607. - PubMed
-
- Wilson PWF, Kannel WB, Silbershatz H, D’Agostino R. Clustering of metabolic factors and coronary heart disease. Arch Intern Med. 1999;159:1104–9. - PubMed
-
- Garg A. Acquired and inherited lipodystrophies. N Engl J Med. 2004;350:1220–34. - PubMed
-
- Albu J, Kovera AJ, Johnson JA. Fat distribution and health in obesity: in vivo body composition studies. Ann NY Acad Sci. 2000;904:491–501. - PubMed
-
- Safrin S, Grunfeld C. Fat distribution and metabolic changes in patients with HIV infection. AIDS. 1999;13:2493–505. - PubMed
Publication types
MeSH terms
Grants and funding
- R01 DK040414-12/DK/NIDDK NIH HHS/United States
- P01 DK042618-12S10002/DK/NIDDK NIH HHS/United States
- M01 RR000645/RR/NCRR NIH HHS/United States
- R01 DK042612/DK/NIDDK NIH HHS/United States
- P30 DK026687-289012/DK/NIDDK NIH HHS/United States
- P01 DK042618-11S10002/DK/NIDDK NIH HHS/United States
- P01 DK042618-11S20002/DK/NIDDK NIH HHS/United States
- P3O DK26687/DK/NIDDK NIH HHS/United States
- R01 DK40414/DK/NIDDK NIH HHS/United States
- P30 DK026687-279012/DK/NIDDK NIH HHS/United States
- P01 DK042618-12S20002/DK/NIDDK NIH HHS/United States
- P01 DK042618-110002/DK/NIDDK NIH HHS/United States
- P01-DK42612/DK/NIDDK NIH HHS/United States
- P01 DK042618-120002/DK/NIDDK NIH HHS/United States
- P30 DK026687-269012/DK/NIDDK NIH HHS/United States
- MO1RR00645/RR/NCRR NIH HHS/United States
- P30 DK026687/DK/NIDDK NIH HHS/United States
- M01 RR000645-330951/RR/NCRR NIH HHS/United States
LinkOut - more resources
Full Text Sources
Medical
Research Materials
