. 2007 Sep 1;583(Pt 2):521-36.
doi: 10.1113/jphysiol.2007.135657. Epub 2007 Jul 5.

Modulation of TASK-like background potassium channels in rat arterial chemoreceptor cells by intracellular ATP and other nucleotides

Affiliations

Modulation of TASK-like background potassium channels in rat arterial chemoreceptor cells by intracellular ATP and other nucleotides

Rodrigo Varas et al. J Physiol. .

Abstract

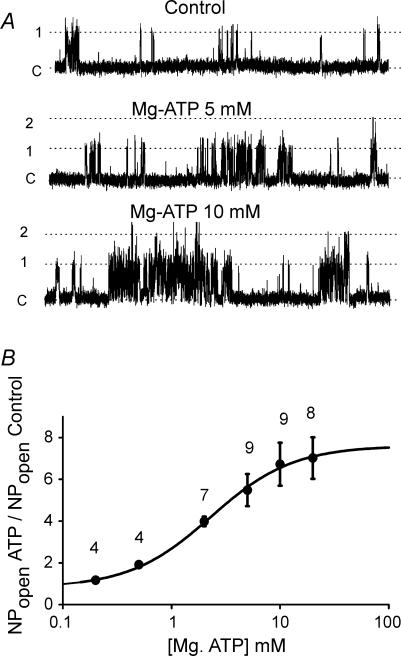
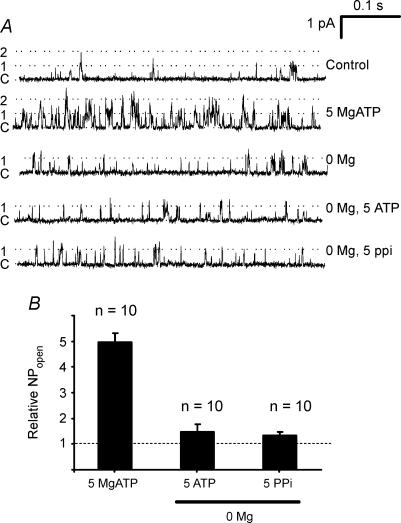
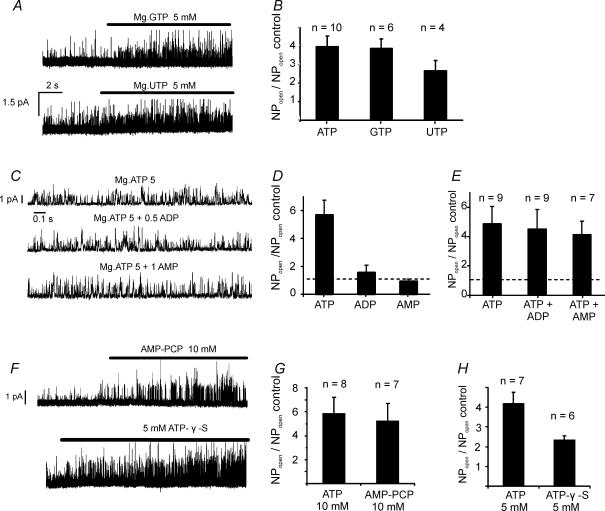
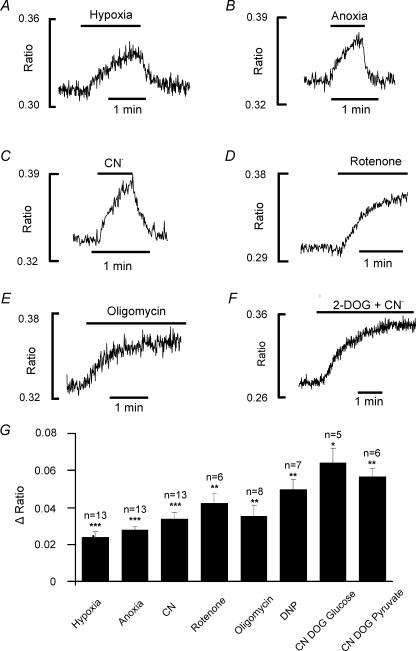
The carotid body's physiological role is to sense arterial oxygen, CO(2) and pH. It is however, also powerfully excited by inhibitors of oxidative phosphorylation. This latter observation is the cornerstone of the mitochondrial hypothesis which proposes that oxygen is sensed through changes in energy metabolism. All of these stimuli act in a similar manner, i.e. by inhibiting a background TASK-like potassium channel (K(B)) they induce membrane depolarization and thus neurosecretion. In this study we have evaluated the role of ATP in modulating K(B) channels. We find that K(B) channels are strongly activated by MgATP (but not ATP(4)(-)) within the physiological range (K(1/2) = 2.3 mm). This effect was mimicked by other Mg-nucleotides including GTP, UTP, AMP-PCP and ATP-gamma-S, but not by PP(i) or AMP, suggesting that channel activity is regulated by a Mg-nucleotide sensor. Channel activation by MgATP was not antagonized by either 1 mm AMP or 500 microm ADP. Thus MgATP is probably the principal nucleotide regulating channel activity in the intact cell. We therefore investigated the effects of metabolic inhibition upon both [Mg(2+)](i), as an index of MgATP depletion, and channel activity in cell-attached patches. The extent of increase in [Mg(2+)](i) (and thus MgATP depletion) in response to inhibition of oxidative phosphorylation were consistent with a decline in [MgATP](i) playing a prominent role in mediating inhibition of K(B) channel activity, and the response of arterial chemoreceptors to metabolic compromise.


Figures

Figure 1
Figure 1. Background K+ channel activity in cell-attached and inside-out patches
A, three sections, 1 s each, from a continuous recording of background K+ channel activity in a cell-attached patch. The cell was superfused with a normal bicarbonate-buffered Tyrode solution. Pipette potential was 0 mV (patch membrane potential = cell resting potential). B, three sections of a continuous recording (1 s each) taken from the same patch as in A, but after formation of the inside patch recording configuration and following completion of channel rundown. The internal aspect of the patch was superfused with an intracellular solution lacking ATP. Pipette potential = 70 mV (patch membrane potential =−70 mV).
Figure 7
Figure 7. Effects of rotenone on channel activity in cell-attached patch
A, recording from a cell-attached patch. The cell was bathed in high K+ Ca2+-free bicarbonate-buffered Tyrode solution. Pipette potential was +80 mV (membrane potential approx −90 mV). Trace shows effects of application of 1 μm rotenone. B, sections of cell-attached patch recording from experiment shown in part A. Traces on the right are taken from the control period and those on the left > 40 s after application of rotenone. C, all-points histogram from above experiment. Ten-second sections of trace were analysed from the control period (light bars) and after > 40 s of exposure to rotenone (dark bars). Bin width = 50 fA. Note that rotenone decreases the frequency of all points representing channel activity in the patch. Note also that the peak amplitude is the same in the presence and absence of rotenone. D, summary of effects of rotenone on channel activity in cell-attached patches. NPopen in the presence of rotenone was determined > 40 s after application of this compound. Data are means +s.e.m.; n = 6. E, time course of effects of rotenone on channel activity in cell-attached patches. Mean NPopen was determined at 2 s intervals from continuous records of single channel activity. Data are means ± s.e.m. for 6 patches.
Figure 2
Figure 2. Effects of 5 mm MgATP on channel activity in an inside-out patch
A, top trace shows a continuous recording of channel activity in an inside-out patch. The patch was bathed in intracellular solution with or without 5 mm MgATP. Pipette potential was +80 mV (membrane potential −80 mV). Lower trace shows channel activity calculated as NPopen over successive 2 s intervals. B, inside-out single channel recording from another patch on a faster time base showing increase in channel activity in response to 5 mm MgATP. Pipette potential +70 mV (membrane potential −70 mV). C, all-points histograms constructed from two 10 s sections of an inside-out recording in the absence (black bars) and presence (grey bars) of 5 mm MgATP. Data taken from the patch shown in B at a pipette potential of +70 mV. Bin width 50 fA. D, frequency histogram showing extent of increase in channel activity caused by 5 mm MgATP. Relative NPopen is calculated as the ratio of NPopen in the presence of MgATP divided by that in its absence (control NPopen). NPopen was determined using a 50% threshold crossing method. Data from 59 inside-out patches.
Figure 4
Figure 4. Effects of MgATP on rundown
A, sections of recording from the same patch under cell-attached conditions in normal bicarbonate Tyrode solution (top trace) at a pipette potential of +70 mV (membrane potential approx −140 mV), and following patch excision into an intracellular solution containing 5 mm ATP (middle trace) at a pipette potential of +70 mV, and following subsequent MgATP removal (bottom trace). Note significant rundown in channel activity even in the presence of MgATP. B, comparison of channel rundown observed in patches excised into an intracellular solution containing 5 mm MgATP with that observed upon patch excision into an ATP-free intracellular solution. NPopen was calculated for each patch at least 60 s following patch excision and is expressed relative to channel activity (NPopen) recorded from the same patch in the cell-attached configuration prior to patch excision. Data are means (+s.e.m.).
Figure 3
Figure 3. Dose–response effects of MgATP on single channel activity
A, inside-out patch recordings of background channel activity in the presence of varying levels of MgATP. Pipette potential +70 mV. B, summary of effects of 0.2–20 mm MgATP on single channel activity. Channel activity, determined as NPopen in the presence of MgATP, was normalized to that observed in the absence of MgATP (NPopen/NPopen,basal) for each patch/MgATP concentration. One-way analysis of variance showed significant effect of MgATP (P < 0.0001). Bonferoni's post hoc t test revealed that the effects of MgATP were significant at levels of 0.5 mm and above (P < 0.05). Line of best fit is the Hill equation obtained by nonlinear regression analysis (SigmaPlot). Hill constant = 1.15, EC50 = 2.3 mm. Data points are means ± s.e.m. with n indicated above each point.
Figure 5
Figure 5. Effects of ATP (Mg free) and pyrophosphate on channel activity
A, inside-out patch recordings in control intracellular solution containing 4 mm free [Mg2+] (top trace), intracellular solution plus 5 mm MgATP (second trace), magnesium-free intracellular solution (third trace), magnesium-free intracellular solution plus 5 mm ATP (fourth trace) and Mg-free intracellular solution plus 5 mm pyrophosphate (bottom trace). B, comparison of effects of 5 mm MgATP, Mg-free ATP and Mg-free pyrophosphate on channel activity. Relative NPopen was calculated using either Mg-containing intracellular solution as control (for MgATP) or Mg-free intracellular solution as control (for Mg-free ATP and pyrophosphate). Data are means (+s.e.m.). Effects of Mg-free ATP (n = 10) and pyrophosphate (n = 10) were not significant.
Figure 6
Figure 6. Effects of other nucleotides on channel activity
A, recordings from the same inside-out patch showing effects of both 5 mm MgGTP (top) and 5 mm MgUTP (bottom) on channel activity. Pipette potential +70 mV. B, summary of effects of MgGTP and MgUTP, compared to MgATP, on channel activity in inside-out patches. Channel activity is expressed as NPopen in presence of nucleotide relative to NPopen,basal in absence of nucleotide. Plot shows means +s.e.m., with n indicated above each bar. C, recording of single channel activity in an excised inside-out patch. All records are from the same patch showing channel activity in the presence of 5 mm MgATP, in the presence of 5 mm MgATP + 0.5 mm ADP and in the presence of 5 mm MgATP + 1 mm AMP. D, effects of 0.5 mm ADP and 1 mm AMP alone on relative channel activity. Note lack of effect of either nucleotide at these concentrations on channel activity. E, effects of 0.5 mm ADP and 1 mm AMP on relative channel activity recorded in the presence of 5 mm MgATP. F, inside-out patch recording showing effects of 10 mm AMP-PCP or 5 mm ATP-γ-S on single channel activity. Pipette potential +70 mV. G, comparison of effects of 10 mm AMP-PCP with those of 10 mm ATP on relative channel activity. H, comparison of effects of 5 mm ATP with those of 5 mm ATP-γ-S on relative channel activity.
Figure 8
Figure 8. Effects of hypoxia and metabolic inhibitors on cytosolic magnesium
A–F, emission fluorescence ratio (405/495) of Mag-Indo-1 in isolated type-1 cells showing effects of, hypoxia (A), anoxia (B), 2 mm cyanide (C), 1 μm rotenone (D), 2.5 μg ml−1 oligomycin B (E), 2 mm cyanide + 10 mm 2-deoxyglucose (glucose-free Tyrode solution containing 5 mm pyruvate) (F). G, comparison of effects of brief application (1–1.5 min) of hypoxia, anoxia, cyanide, rotenone, oligomycin and 2,4-dinitrophenol with those of prolonged application of cyanide (2 mm) plus 2-deoxyglucose (10 mm) in both glucose-containing and glucose-free (+ pyruvate) Tyrode solution. Increase in ratio signifies increase in intracellular magnesium. Data are means +s.e.m.; n is indicated above each bar; *P < 0.002, **P < 0.001, ***P < 0.0001 (paired t test). Recordings were conducted in a Ca2+-free Tyrode solution.

Similar articles

Cited by

References

    1. Abraham MR, Selivanov VA, Hodgson DM, Pucar D, Zingman LV, Wieringa B, Dzeja PP, Alekseev AE, Terzic A. Coupling of cell energetics with membrane metabolic sensing. Integrative signaling through creatine kinase phosphotransfer disrupted by M-CK gene knock-out. J Biol Chem. 2002;277:24427–24434. - PubMed
    1. Allen DG, Morris PG, Orchard CH, Pirolo JS. A nuclear magnetic resonance study of metabolism in the ferret heart during hypoxia and inhibition of glycolysis. J Physiol. 1985;361:185–204. - PMC - PubMed
    1. Anichkov S, Belen'kii M. Pharmacology of the Carotid Body Chemoreceptors. Oxford: Pergamon Press; 1963.
    1. Ashcroft FM. Adenosine 5′-triphosphate-sensitive potassium channels. Annu Rev Neurosci. 1988;11:97–118. - PubMed
    1. Bayliss DA, Talley EM, Sirois JE, Lei Q. TASK-1 is a highly modulated pH-sensitive ‘leak’ K+ channel expressed in brainstem respiratory neurons. Respir Physiol. 2001;129:159–174. - PubMed

Publication types

MeSH terms