. 2007 Jul 3;104(27):11400-5.
doi: 10.1073/pnas.0704372104. Epub 2007 Jun 28.

Let-7 expression defines two differentiation stages of cancer

Affiliations

Let-7 expression defines two differentiation stages of cancer

Scott Shell et al. Proc Natl Acad Sci U S A. .

Abstract

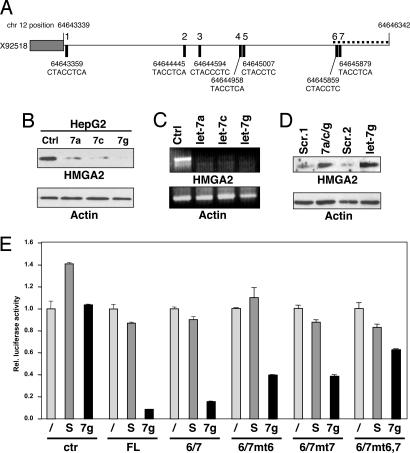
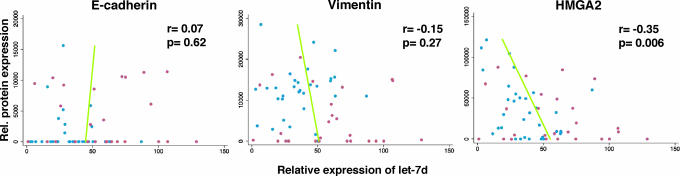
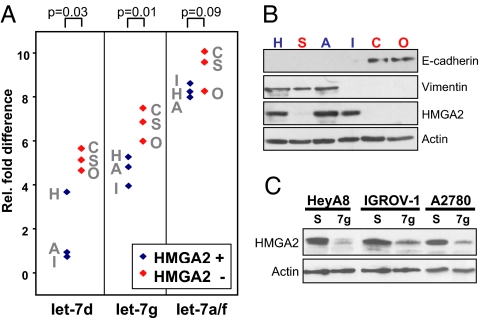
The early phases of carcinogenesis resemble embryonic development, often involving the reexpression of embryonic mesenchymal genes. The NCI60 panel of human tumor cell lines can genetically be subdivided into two superclusters (SCs) that correspond to CD95 Type I and II cells. SC1 cells are characterized by a mesenchymal and SC2 cells by an epithelial gene signature, suggesting that SC1 cells represent less differentiated, advanced stages of cancer. miRNAs are small 20- to 22-nucleotide-long noncoding RNAs that inhibit gene expression at the posttranscriptional level. By performing miRNA expression analysis on 10 Type I and 10 Type II cells, we have determined that SC1 cells express low and SC2 cells high levels of the miRNA let-7, respectively, suggesting that let-7 is a marker for less advanced cancers. Expression of the let-7 target high-mobility group A2 (HMGA2), an early embryonic gene, but not of classical epithelial or mesenchymal markers such as E-cadherin or vimentin, inversely correlated with let-7 expression in SC1 and SC2 cells. Using ovarian cancer as a model, we demonstrate that expression of let-7 and HMGA2 is a better predictor of prognosis than classical markers such as E-cadherin, vimentin, and Snail. These data identify loss of let-7 expression as a marker for less differentiated cancer.


Conflict of interest statement

The authors declare no conflict of interest.

Figures

Fig. 1.
Fig. 1.
Identification of let-7 as a marker for Type II/SC2 cells. (A) Gene array analysis of the expression of miRNAs in 10 Type I and 10 Type II cell lines. Seventy-nine of 287 human miRNAs on the chip were significantly expressed in the 20 cell lines (see Methods and SI Table 1). No single miRNA was found to be equally expressed in all cells, suggesting that miRNAs do not have general housekeeping functions in tumor cells. The expression of miRNAs between SC1 and SC2 cells was therefore calculated relative to the mean of the signal intensities of the 79 miRNAs that are expressed in the 20 tumor cells (SI Table 2). Shown are all miRNAs that were significantly expressed (see Methods) and sorted according to P values from t tests of expression differences between Type I or II cell lines. Four miRNAs with a highly significant P value of <0.001 are boxed with a stippled line. (B) Relative fold difference of let-7d, mir-98, let-7a/f, and let-7g expression between the 10 Type I and 10 Type II cancer cell lines measured by real-time PCR. Data were normalized by determining the ratio of let-7 expression to that of the small nuclear RNA U6 as described before (33). The let-7/U6 ratios were plotted relative to the ratio found in HepG2 cells. HeLa and HepG2 cells were chosen as positive or negative controls for let-7 expression, respectively. We determined that the probe for let-7f does not discriminate between let-7f and let-7a (data not shown). (C) Analysis of the expression of let-7d in 59 of the NCI60 cells. (Left) Expression of let-7d in the 22 Type I (blue) and Type II (red) cells previously identified among the NCI60 cells (13) is shown. (Left) Expression in the SC1 (blue) and SC2 (red) cell lines among the 59 NCI60 cells is shown. The asterisk marks an outlier in the SC1 group. Without this one value, the P value changed to 0.0012 (two sample t test). In this independent performed analysis, we compared the expression of let-7d relative to the mean of expression of a very similar set of 65 miRNAs that was used to analyze the miRNA chip data (SI Table 2).
Fig. 2.
Fig. 2.
Identification of HMGA2 as a direct target of let-7. (A) Schematic of the 3′UTR at the human HMGA2 genomic locus located on chromosome 12. The gray box depicts the 3′-end of the ORF, whereas the horizontal line depicts the 3′-UTR spanning ≈3 kb. Solid rectangles indicate the precise locations with nucleotide positions on chromosome 12 of the seven putative let-7 binding sites and the seed match to the let-7 family of miRNAs. The dotted line located at the distal end of the 3′-UTR represents the fragment of the 3′-UTR containing the sixth and seventh putative let-7 sites that was used for the Renilla reporter experiments in Fig. 2E. (B) HMGA2 protein expression is negatively regulated by let-7. HepG2 cells were transiently transfected with let-7a, let-7c, let-7g, or control precursor miRNA. β-actin was detected to demonstrate equal loading. Ctrl, scrambled control. (C) HMGA2 RNA is degraded with increased levels of let-7. HepG2 cells were transfected with miRNAs as in Fig. 2B, and after 72 h mRNA for HMGA2 was detected by RT-PCR. β-actin is shown as a control. (D) Induction of HMGA2 protein through inhibiting let-7. HeLa cells were transfected either with a mixture of let-7a, let-7c, and let-7g (total of 180 pmol) or with let-7d (60 pmol) inhibitor alone. Scr, scrambled oligonucleotide as controls at two concentrations; Scr.1, 180 pmol; Scr.2, 60 pmol. (E) HMGA2 is posttranscriptionally regulated through the 3′-UTR by let-7. Renilla luciferase reporter assays were performed with reporter plasmid psiCHECK (ctr), psiCHECK-HMGA2 full-length 3′-UTR (FL), or psiCHECK-HMGA2 3′-UTR 6/7 (6/7), together with either 1 pmol of premiR scrambled (S) or premiR let-7g (7g). PsiCHECK-HMGA2 3′-UTR 6/7mt6 (6/7mt6), psiCHECK-HMGA2 3′-UTR 6/7mt7 (6/7mt7), or psiCHECK-HMGA2 3′-UTR 6/7mt6,7 (6/7mt6,7), which harbor mutations in the seed matches in either LCS6, LCS7, or both, were also used in the luciferase assay experiment. Renilla luciferase activity was normalized to the internally controlled firefly luciferase activity.
Fig. 3.
Fig. 3.
Analysis of the protein expression levels of HMGA2, E-cadherin, and vimentin, and correlation with let-7d expression in 59 NCI60 cell lines. Protein expression was determined by Western blotting (see SI Fig. 12). Expression levels in SC1 cells are shown as blue dots and SC2 cells as red dots. Predicted let-7d values from a univariate linear regression are plotted against protein expression. Pearson correlation coefficients (r) and P values (p) are reported.
Fig. 4.
Fig. 4.
HMGA2 in OC cell lines is under control of let-7. (A) Relative fold difference of let-7d, let-7g, and let-7a/f miRNA expression in six randomly chosen OC cell lines measured by real-time PCR and normalized to U6 expression. A, A2780; C, CAOV3; H, HeyA8; I, IGROV-I; O, OVCAR-5; S, SKOV3ip. Two sample t test results are shown. (B) Western blot analysis of the same cells analyzed in A. Let-7hi/HMGA2lo cells in A and B are labeled in red, let-7lo/HMGA2hi cells in blue. β-actin was detected to demonstrate equal loading. (C) The three HMGA2-expressing cells were transfected with let-7g, and HMGA2 protein amount was determined by Western blotting. β-actin was detected to demonstrate equal loading. S, scrambled control.
Fig. 5.
Fig. 5.
HMGA2 expression is increased early in OC progression. (A) Immunohistochemistry for HMGA2 of representative normal (Left Upper) and tumor tissues (Right Upper and Lower) from OC patients. (Magnification: tumors, ×200; ovary, ×400.) Arrowhead points to the surface epithelium of a normal ovary in a patient with a benign tumor. (B) Immunohistochemical detection of HMGA2 in tumor from a patient with advanced OC. C, carcinoma; O, ovary.
Fig. 6.
Fig. 6.
HMGA2 and let-7d expression inversely correlate with survival of OC patients. (A) Progression-free survival of 100 OC patients depending on the staining intensity for HMGA2. Primary tumors from 100 patients (with FIGO stage II–IV) on a tissue array were stained for HMGA2. Splitting the group at the median resulted in 0 < 132 and 1 > 132. Only samples with >5% HMGA2-positive cells were included. The patient group is described in SI Table 3. (B) Expression of let-7d in RNA samples extracted from tumor tissue with low <100 (n = 8) or high >160 (n = 9) HMGA2 staining. Fold difference relative to the sample with the lowest let-7d expression (set to 1) is shown. Expression of let-7d was normalized to U6. P value is the result of two sample t test. (C) Progression-free survival by the ratio of HMGA2 intensity to let-7 ΔCT (splitting at the median: 0 < 54 and 1 > 54 high) including 53 subjects with FIGO stage II, III, or IV and HMGA 2% positive >5%. Note that two let-7 ΔCT values <0 were given a threshold value of 0.20.

Similar articles

Cited by

References

    1. He L, Thomson JM, Hemann MT, Hernando-Monge E, Mu D, Goodson S, Powers S, Cordon-Cardo C, Lowe SW, Hannon GJ, Hammond SM. Nature. 2005;435:828–833. - PMC - PubMed
    1. Voorhoeve PM, le Sage C, Schrier M, Gillis AJ, Stoop H, Nagel R, Liu YP, van Duijse J, Drost J, Griekspoor A, et al. Cell. 2006;124:1169–1181. - PubMed
    1. Calin GA, Dumitru CD, Shimizu M, Bichi R, Zupo S, Noch E, Aldler H, Rattan S, Keating M, Rai K, et al. Proc Natl Acad Sci USA. 2002;99:15524–15529. - PMC - PubMed
    1. Akao Y, Nakagawa Y, Naoe T. Biol Pharm Bull. 2006;29:903–906. - PubMed
    1. Takamizawa J, Konishi H, Yanagisawa K, Tomida S, Osada H, Endoh H, Harano T, Yatabe Y, Nagino M, Nimura Y, et al. Cancer Res. 2004;64:3753–3756. - PubMed

Publication types

MeSH terms