Role of human immunodeficiency virus (HIV)-specific T-cell immunity in control of dual HIV-1 and HIV-2 infection
- PMID: 17582003
- PMCID: PMC1951418
- DOI: 10.1128/JVI.00117-07
Role of human immunodeficiency virus (HIV)-specific T-cell immunity in control of dual HIV-1 and HIV-2 infection
Abstract
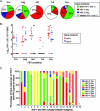
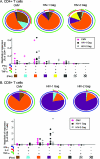
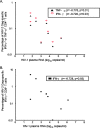
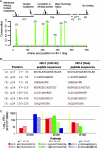
Progressive immune dysfunction and AIDS develop in most cases of human immunodeficiency virus type 1 (HIV-1) infection but in only 25 to 30% of persons with HIV-2 infection. However, the natural history and immunologic responses of individuals with dual HIV-1 and HIV-2 infection are largely undefined. Based on our previous findings, we hypothesized that among patients with dual infection the control of HIV-1 is associated with the ability to respond to HIV-2 Gag epitopes and to maintain HIV-specific CD4(+) T-cell responses. To test this, we compared the HIV-specific ex vivo IFN-gamma enzyme-linked immunospot (ELISPOT) assay responses of 19 dually infected individuals to those of persons infected with HIV-1 or HIV-2 only. Further, we assessed the functional profile of HIV Gag-specific CD4(+) and CD8(+) T cells from nine HIV dually infected patients by using a multicolor intracellular cytokine staining assay. As determined by ELISPOT assay, the magnitude and frequency of IFN-gamma-secreting T-cell responses to gene products of HIV-1 were higher than those to gene products of HIV-2 (2.64 versus 1.53 log(10) IFN-gamma spot-forming cells/10(6) cells [90% versus 63%, respectively].) Further, HIV-1 Env-, Gag-, and Nef- and HIV-2 Gag-specific responses were common; HIV-2 Nef-specific responses were rare. HIV-specific CD4(+) T helper responses were detected in nine of nine dually infected subjects, with the majority of these T cells producing gamma interferon (IFN-gamma) and tumor necrosis factor alpha (TNF-alpha) and, to a lesser extent, interleukin-2. The HIV-1 plasma viral load was inversely correlated with HIV-2 Gag-specific IFN-gamma-/TNF-alpha-secreting CD4(+) and HIV-2 Gag-specific IFN-gamma-secreting CD8(+) T cells. In conclusion, the T-cell memory responses associated with containment of single HIV-1 and HIV-2 infection play a similar significant role in the immune control of dual HIV-1 and HIV-2 infection.
Figures


Similar articles
-
Comparison of human immunodeficiency virus (HIV)-specific T-cell responses in HIV-1- and HIV-2-infected individuals in Senegal.J Virol. 2004 Dec;78(24):13934-42. doi: 10.1128/JVI.78.24.13934-13942.2004. J Virol. 2004. PMID: 15564501 Free PMC article.
-
Characterization of HIV-1 Gag-specific T cell responses in chronically infected Indian population.Clin Exp Immunol. 2005 Nov;142(2):388-97. doi: 10.1111/j.1365-2249.2005.02926.x. Clin Exp Immunol. 2005. PMID: 16232229 Free PMC article.
-
Polyfunctional CD4(+) T cell responses in HIV-1-infected viral controllers compared with those in healthy recipients of an adjuvanted polyprotein HIV-1 vaccine.Vaccine. 2013 Aug 12;31(36):3739-46. doi: 10.1016/j.vaccine.2013.05.021. Epub 2013 May 21. Vaccine. 2013. PMID: 23707169 Clinical Trial.
-
HIV and inflammation.Curr HIV Res. 2005 Jul;3(3):243-59. doi: 10.2174/1570162054368057. Curr HIV Res. 2005. PMID: 16022656 Review.
-
Cytokines and immunological control of Eimeria spp.Int J Parasitol. 1995 Nov;25(11):1331-51. doi: 10.1016/0020-7519(95)00069-e. Int J Parasitol. 1995. PMID: 8635884 Review.
Cited by
-
Association between peripheral γδ T-cell profile and disease progression in individuals infected with HIV-1 or HIV-2 in West Africa.J Acquir Immune Defic Syndr. 2011 Jun 1;57(2):92-100. doi: 10.1097/QAI.0b013e318215a877. J Acquir Immune Defic Syndr. 2011. PMID: 21423026 Free PMC article.
-
HIV-1 outcompetes HIV-2 in dually infected Senegalese individuals with low CD4⁺ cell counts.AIDS. 2013 Sep 24;27(15):2441-50. doi: 10.1097/QAD.0b013e328362e856. AIDS. 2013. PMID: 23665777 Free PMC article.
-
Dynamic regulation of functionally distinct virus-specific T cells.Proc Natl Acad Sci U S A. 2010 Feb 23;107(8):3669-74. doi: 10.1073/pnas.0915168107. Epub 2010 Feb 4. Proc Natl Acad Sci U S A. 2010. PMID: 20133680 Free PMC article.
-
Broad and potent neutralizing antibody responses elicited in natural HIV-2 infection.J Virol. 2012 Jan;86(2):947-60. doi: 10.1128/JVI.06155-11. Epub 2011 Oct 26. J Virol. 2012. PMID: 22031948 Free PMC article.
References
-
- Alabi, A. S., S. Jaffar, K. Ariyoshi, T. Blanchard, M. Schim van der Loeff, A. A. Awasana, T. Corrah, S. Sabally, R. Sarge-Njie, F. Cham-Jallow, A. Jaye, N. Berry, and H. Whittle. 2003. Plasma viral load, CD4 cell percentage, HLA and survival of HIV-1, HIV-2, and dually infected Gambian patients. AIDS 17:1513-1520. - PubMed
-
- Andersson, S., H. Norrgren, Z. da Silva, A. Biague, S. Bamba, S. Kwok, C. Christopherson, G. Biberfeld, and J. Albert. 2000. Plasma viral load in HIV-1 and HIV-2 singly and dually infected individuals in Guinea-Bissau, West Africa: significantly lower plasma virus set point in HIV-2 infection than in HIV-1 infection. Arch. Intern. Med. 160:3286-3293. - PubMed
-
- Anonymous. 1993. Revised classification system for HIV infection and expanded surveillance case definition for AIDS among adolescents and adults. Morb. Mortal. Wkly. Rep. Recomm. Rep. 41:1-19. - PubMed
-
- Bourgeois, C., B. Rocha, and C. Tanchot. 2002. A role for CD40 expression on CD8+ T cells in the generation of CD8+ T-cell memory. Science 297:2060-2063. - PubMed
Publication types
MeSH terms
Substances
Grants and funding
LinkOut - more resources
Full Text Sources
Medical
Research Materials

