GC- and AT-rich chromatin domains differ in conformation and histone modification status and are differentially modulated by Rpd3p
- PMID: 17577398
- PMCID: PMC2394764
- DOI: 10.1186/gb-2007-8-6-r116
GC- and AT-rich chromatin domains differ in conformation and histone modification status and are differentially modulated by Rpd3p
Abstract
Background: Base-composition varies throughout the genome and is related to organization of chromosomes in distinct domains (isochores). Isochore domains differ in gene expression levels, replication timing, levels of meiotic recombination and chromatin structure. The molecular basis for these differences is poorly understood.
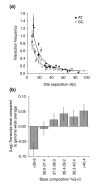
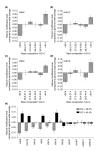
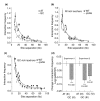
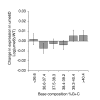
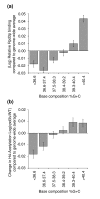
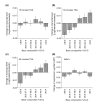
Results: We have compared GC- and AT-rich isochores of yeast with respect to chromatin conformation, histone modification status and transcription. Using 3C analysis we show that, along chromosome III, GC-rich isochores have a chromatin structure that is characterized by lower chromatin interaction frequencies compared to AT-rich isochores, which may point to a more extended chromatin conformation. In addition, we find that throughout the genome, GC-rich and AT-rich genes display distinct levels of histone modifications. Interestingly, elimination of the histone deacetylase Rpd3p differentially affects conformation of GC- and AT-rich domains. Further, deletion of RPD3 activates expression of GC-rich genes more strongly than AT-rich genes. Analyses of effects of the histone deacetylase inhibitor trichostatin A, global patterns of Rpd3p binding and effects of deletion of RPD3 on histone H4 acetylation confirmed that conformation and activity of GC-rich chromatin are more sensitive to Rpd3p-mediated deacetylation than AT-rich chromatin.
Conclusion: We find that GC-rich and AT-rich chromatin domains display distinct chromatin conformations and are marked by distinct patterns of histone modifications. We identified the histone deacetylase Rpd3p as an attenuator of these base composition-dependent differences in chromatin status. We propose that GC-rich chromatin domains tend to occur in a more active conformation and that Rpd3p activity represses this propensity throughout the genome.
Figures

Similar articles
-
Histone deacetylase Rpd3 antagonizes Sir2-dependent silent chromatin propagation.Nucleic Acids Res. 2009 Jun;37(11):3699-713. doi: 10.1093/nar/gkp233. Epub 2009 Apr 16. Nucleic Acids Res. 2009. PMID: 19372273 Free PMC article.
-
Genome-wide analysis of the relationship between transcriptional regulation by Rpd3p and the histone H3 and H4 amino termini in budding yeast.Mol Cell Biol. 2004 Oct;24(20):8823-33. doi: 10.1128/MCB.24.20.8823-8833.2004. Mol Cell Biol. 2004. PMID: 15456858 Free PMC article.
-
The histone methylase Set2p and the histone deacetylase Rpd3p repress meiotic recombination at the HIS4 meiotic recombination hotspot in Saccharomyces cerevisiae.DNA Repair (Amst). 2008 Aug 2;7(8):1298-308. doi: 10.1016/j.dnarep.2008.04.009. Epub 2008 Jun 2. DNA Repair (Amst). 2008. PMID: 18515193 Free PMC article.
-
Histone acetylation and deacetylation in yeast.Nat Rev Mol Cell Biol. 2003 Apr;4(4):276-84. doi: 10.1038/nrm1075. Nat Rev Mol Cell Biol. 2003. PMID: 12671650 Review.
-
Genome-wide patterns of histone modifications in yeast.Nat Rev Mol Cell Biol. 2006 Sep;7(9):657-66. doi: 10.1038/nrm1986. Epub 2006 Aug 16. Nat Rev Mol Cell Biol. 2006. PMID: 16912715 Review.
Cited by
-
Genome-wide identification of copy neutral loss of heterozygosity reveals its possible association with spatial positioning of chromosomes.Hum Mol Genet. 2023 Mar 20;32(7):1175-1183. doi: 10.1093/hmg/ddac278. Hum Mol Genet. 2023. PMID: 36349694 Free PMC article.
-
Analysis of long-range chromatin interactions using Chromosome Conformation Capture.Methods. 2012 Nov;58(3):192-203. doi: 10.1016/j.ymeth.2012.07.022. Epub 2012 Aug 15. Methods. 2012. PMID: 22903059 Free PMC article.
-
GC3 biology in corn, rice, sorghum and other grasses.BMC Genomics. 2010 May 16;11:308. doi: 10.1186/1471-2164-11-308. BMC Genomics. 2010. PMID: 20470436 Free PMC article.
-
Integrative modeling reveals key chromatin and sequence signatures predicting super-enhancers.Sci Rep. 2019 Feb 27;9(1):2877. doi: 10.1038/s41598-019-38979-9. Sci Rep. 2019. PMID: 30814546 Free PMC article.
-
A pathway-centric view of spatial proximity in the 3D nucleome across cell lines.Sci Rep. 2016 Dec 15;6:39279. doi: 10.1038/srep39279. Sci Rep. 2016. PMID: 27976707 Free PMC article.
References
-
- Versteeg R, van Schaik BD, van Batenburg MF, Roos M, Monajemi R, Caron H, Bussemaker HJ, van Kampen AH. The human transcriptome map reveals extremes in gene density, intron length, GC content, and repeat pattern for domains of highly and weakly expressed genes. Genome Res. 2003;13:1998–2004. doi: 10.1101/gr.1649303. - DOI - PMC - PubMed
Publication types
MeSH terms
Substances
Grants and funding
LinkOut - more resources
Full Text Sources
Molecular Biology Databases
Miscellaneous

