

Hyperglycemia regulates thioredoxin-ROS activity through induction of thioredoxin-interacting protein (TXNIP) in metastatic breast cancer-derived cells MDA-MB-231
- PMID: 17555594
- PMCID: PMC1906826
- DOI: 10.1186/1471-2407-7-96
Hyperglycemia regulates thioredoxin-ROS activity through induction of thioredoxin-interacting protein (TXNIP) in metastatic breast cancer-derived cells MDA-MB-231
Abstract
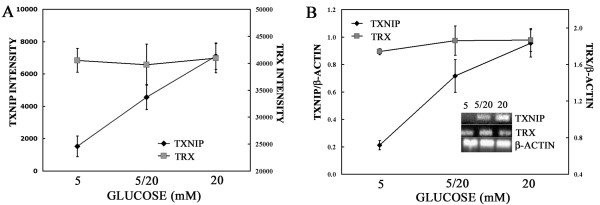
Background: We studied the RNA expression of the genes in response to glucose from 5 mM (condition of normoglycemia) to 20 mM (condition of hyperglycemia/diabetes) by microarray analysis in breast cancer derived cell line MDA-MB-231. We identified the thioredoxin-interacting protein (TXNIP), whose RNA level increased as a gene product particularly sensitive to the variation of the level of glucose in culture media. We investigated the kinesis of the TXNIP RNA and protein in response to glucose and the relationship between this protein and the related thioredoxin (TRX) in regulating the level of reactive oxygen species (ROS) in MDA-MB-231 cells.
Methods: MDA-MB-231 cells were grown either in 5 or 20 mM glucose chronically prior to plating. For glucose shift (5/20), cells were plated in 5 mM glucose and shifted to 20 mM at time 0. Cells were analyzed with Affymetrix Human U133A microarray chip and gene expression profile was obtained. Semi-quantitative RT-PCR and Western blot was used to validate the expression of TXNIP RNA and protein in response to glucose, respectively. ROS were detected by CM-H2DCFDA (5-6-chloromethyl-2',7'-dichlorodihydrofluorescein diacetate) and measured for mean fluorescence intensity with flow cytometry. TRX activity was assayed by the insulin disulfide reducing assay.
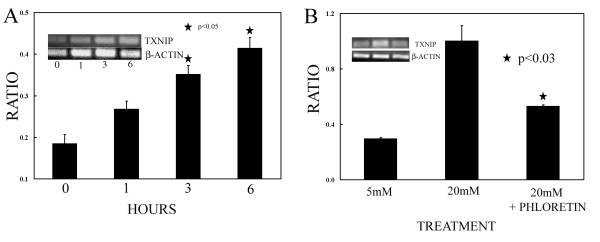
Results: We found that the regulation of TXNIP gene expression by glucose in MDA-MB-231 cells occurs rapidly within 6 h of its increased level (20 mM glucose) and persists through the duration of the conditions of hyperglycemia. The increased level of TXNIP RNA is followed by increased level of protein that is associated with increasing levels of ROS and reduced TRX activity. The inhibition of the glucose transporter GLUT1 by phloretin notably reduces TXNIP RNA level and the inhibition of the p38 MAP kinase activity by SB203580 reverses the effects of TXNIP on ROS-TRX activity.
Conclusion: In this study we show that TXNIP is an oxidative stress responsive gene and its expression is exquisitely regulated by glucose level in highly metastatic MDA-MB-231 cells.
Figures


Similar articles
-
Hyperglycemia-induced thioredoxin-interacting protein expression differs in breast cancer-derived cells and regulates paclitaxel IC50.Clin Cancer Res. 2007 Jun 15;13(12):3724-30. doi: 10.1158/1078-0432.CCR-07-0244. Clin Cancer Res. 2007. PMID: 17575238
-
Response to dexamethasone is glucose-sensitive in multiple myeloma cell lines.J Exp Clin Cancer Res. 2011 Sep 13;30(1):81. doi: 10.1186/1756-9966-30-81. J Exp Clin Cancer Res. 2011. PMID: 21910912 Free PMC article.
-
Hyperglycemia regulates TXNIP/TRX/ROS axis via p38 MAPK and ERK pathways in pancreatic cancer.Curr Cancer Drug Targets. 2014;14(4):348-56. doi: 10.2174/1568009614666140331231658. Curr Cancer Drug Targets. 2014. PMID: 24720336
-
Roles of thioredoxin binding protein (TXNIP) in oxidative stress, apoptosis and cancer.Mitochondrion. 2013 May;13(3):163-9. doi: 10.1016/j.mito.2012.06.004. Epub 2012 Jun 27. Mitochondrion. 2013. PMID: 22750447 Review.
-
The role of TXNIP in cancer: a fine balance between redox, metabolic, and immunological tumor control.Br J Cancer. 2023 Dec;129(12):1877-1892. doi: 10.1038/s41416-023-02442-4. Epub 2023 Oct 4. Br J Cancer. 2023. PMID: 37794178 Free PMC article. Review.
Cited by
-
The Complexity of Sporadic Alzheimer's Disease Pathogenesis: The Role of RAGE as Therapeutic Target to Promote Neuroprotection by Inhibiting Neurovascular Dysfunction.Int J Alzheimers Dis. 2012;2012:734956. doi: 10.1155/2012/734956. Epub 2012 Mar 11. Int J Alzheimers Dis. 2012. PMID: 22482078 Free PMC article.
-
mTORC2 in the center of cancer metabolic reprogramming.Trends Endocrinol Metab. 2014 Jul;25(7):364-73. doi: 10.1016/j.tem.2014.04.002. Epub 2014 May 21. Trends Endocrinol Metab. 2014. PMID: 24856037 Free PMC article.
-
Diabetes and skin cancers: Risk factors, molecular mechanisms and impact on prognosis.World J Clin Cases. 2022 Nov 6;10(31):11214-11225. doi: 10.12998/wjcc.v10.i31.11214. World J Clin Cases. 2022. PMID: 36387789 Free PMC article. Review.
-
Anticancer activity of the iron facilitator LS081.J Exp Clin Cancer Res. 2011 Mar 31;30(1):34. doi: 10.1186/1756-9966-30-34. J Exp Clin Cancer Res. 2011. PMID: 21453502 Free PMC article.
-
High-Carbohydrate Diet Alleviates the Oxidative Stress, Inflammation and Apoptosis of Megalobrama amblycephala Following Dietary Exposure to Silver Nanoparticles.Antioxidants (Basel). 2021 Aug 25;10(9):1343. doi: 10.3390/antiox10091343. Antioxidants (Basel). 2021. PMID: 34572975 Free PMC article.
References
-
- Milazzo G, Giorgino F, Damante F, Sung C, Stampfer MR, Vigneri R, Goldfine ID, Belfiore A. Insulin receptor expression and function in human breast cancer cell lines. Cancer Res. 1992;52:3924–3930. - PubMed
-
- Cullen KJ, Yee D, Sly WS, Perdue J, Hampton B, Lippman ME, Rosen N. Insulin-like growth factor receptor expression and function in human breast cancer. Cancer Res. 1990;50:48–53. - PubMed
-
- Cara JF. Insulin-like growth factors, insulin-like growth factor binding proteins and ovarian androgen production. Horm Res. 1994;42:49–54. - PubMed
Publication types
MeSH terms
Substances
LinkOut - more resources
Full Text Sources
Medical
Miscellaneous
