Comparative Study
. 2007 Jun 6;27(23):6333-47.
doi: 10.1523/JNEUROSCI.5381-06.2007.

Plexin-B2, but not Plexin-B1, critically modulates neuronal migration and patterning of the developing nervous system in vivo

Affiliations
Comparative Study

Plexin-B2, but not Plexin-B1, critically modulates neuronal migration and patterning of the developing nervous system in vivo

Suhua Deng et al. J Neurosci. .

Abstract

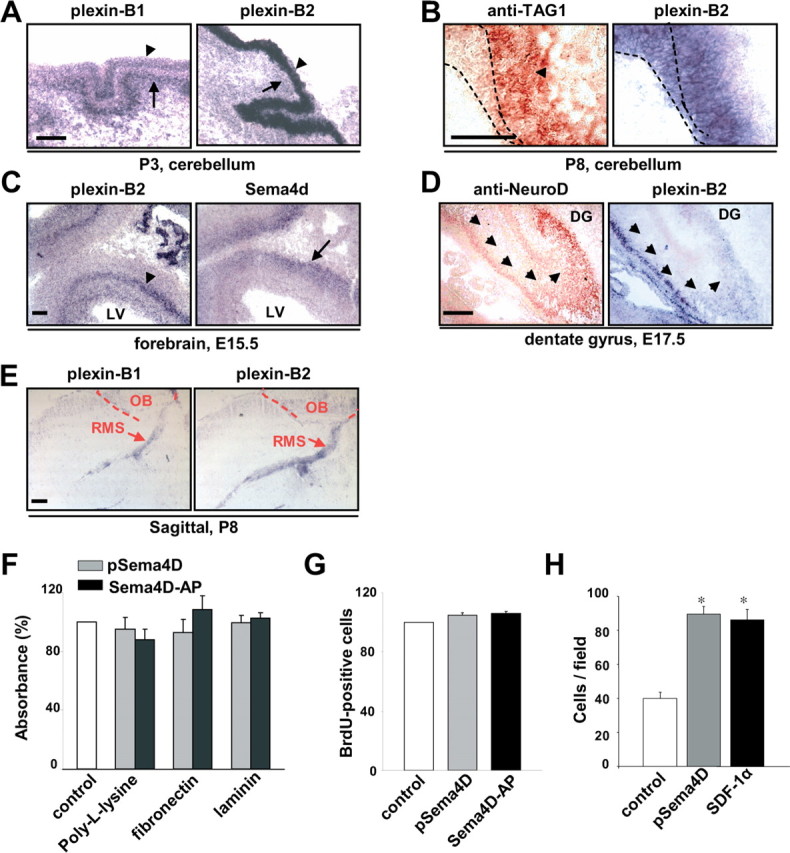
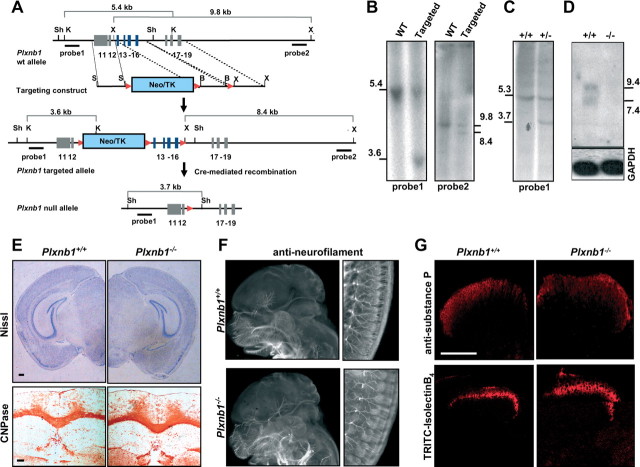
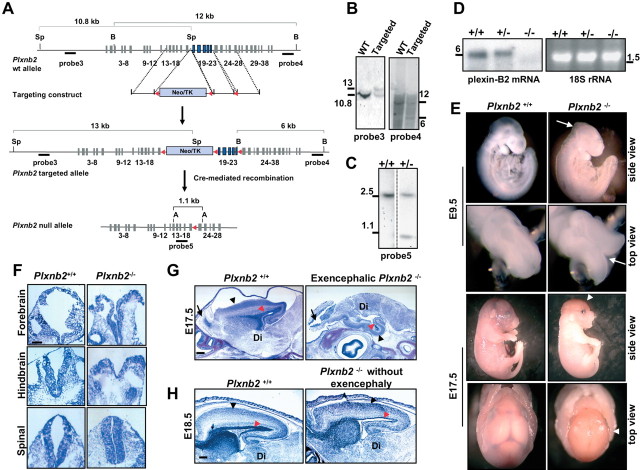
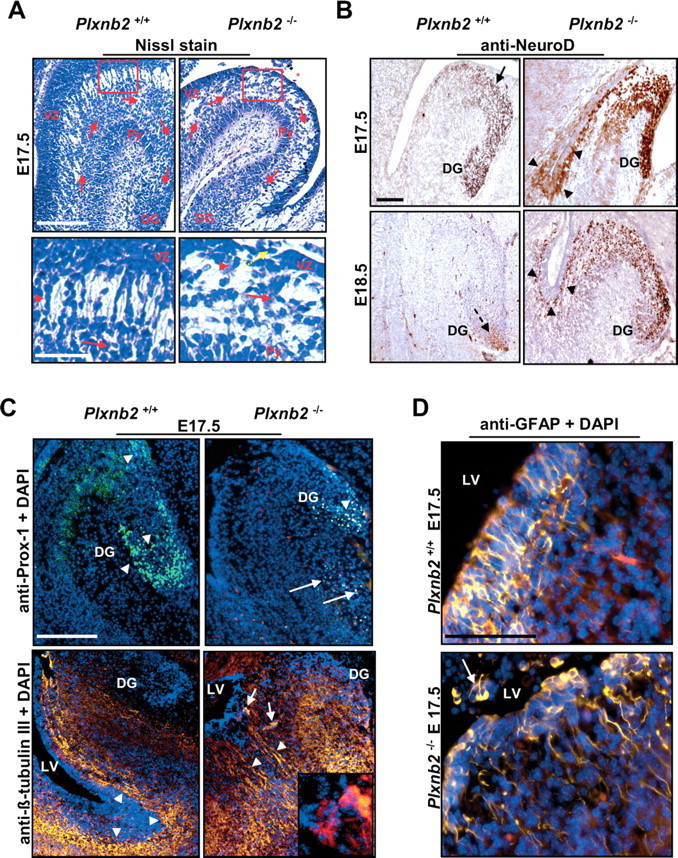
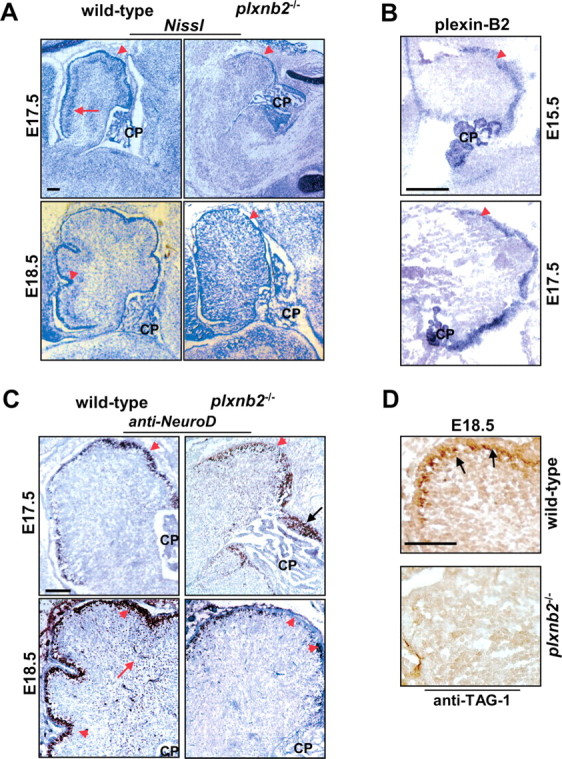
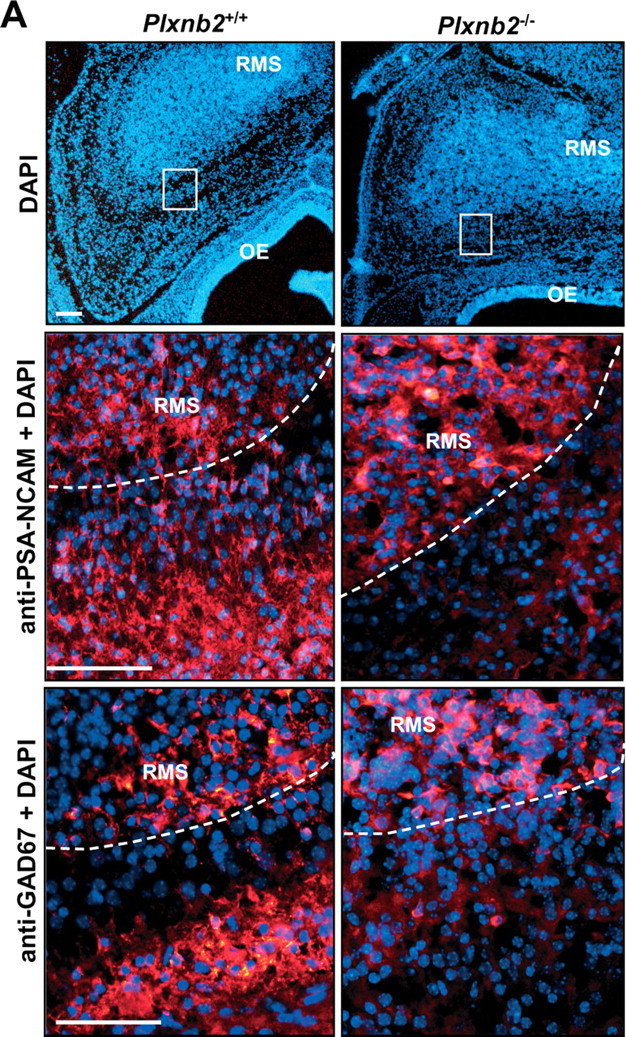
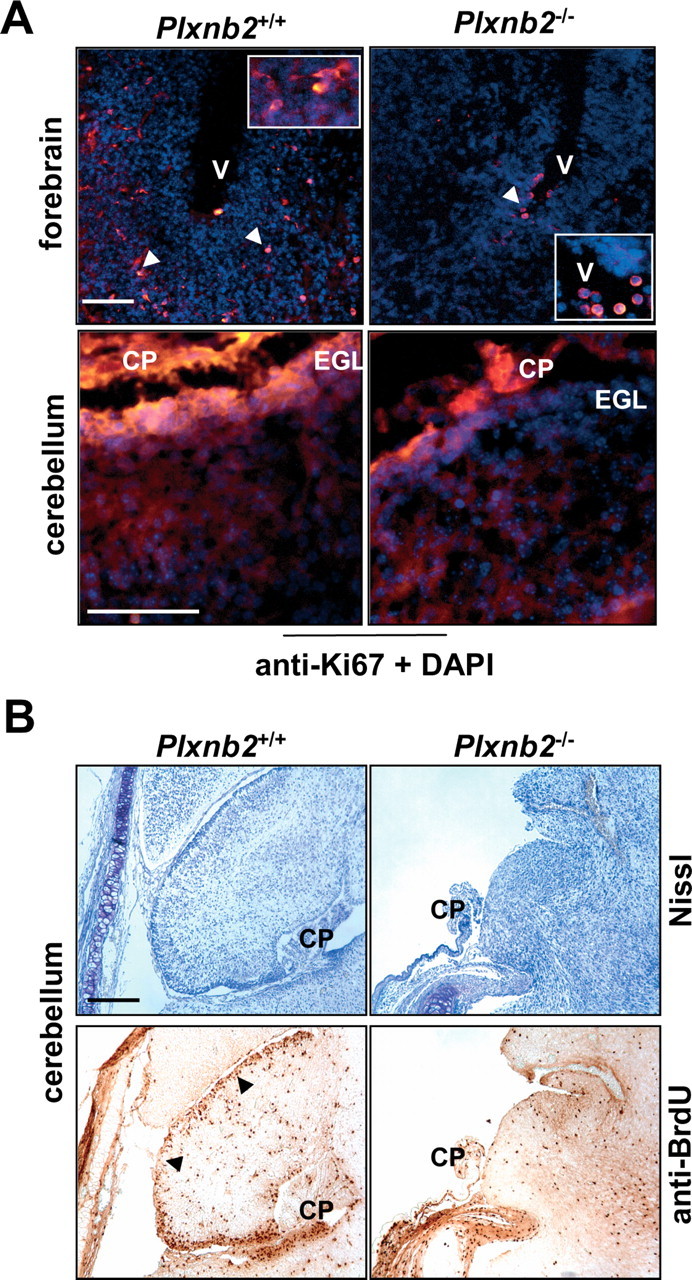
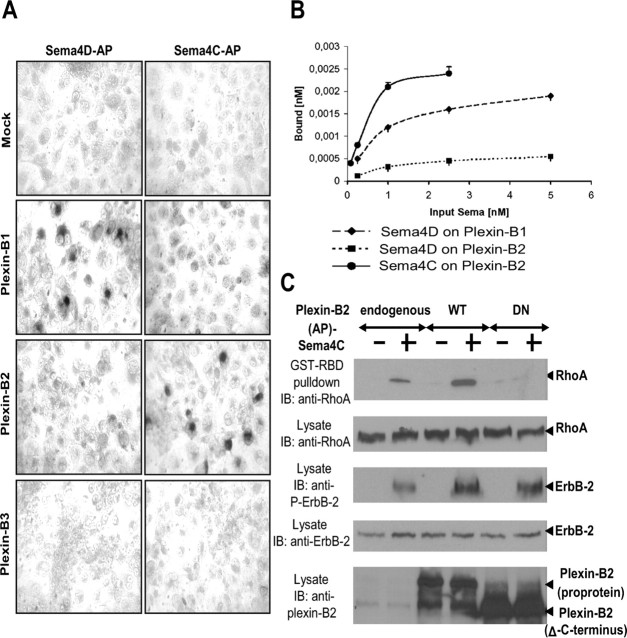
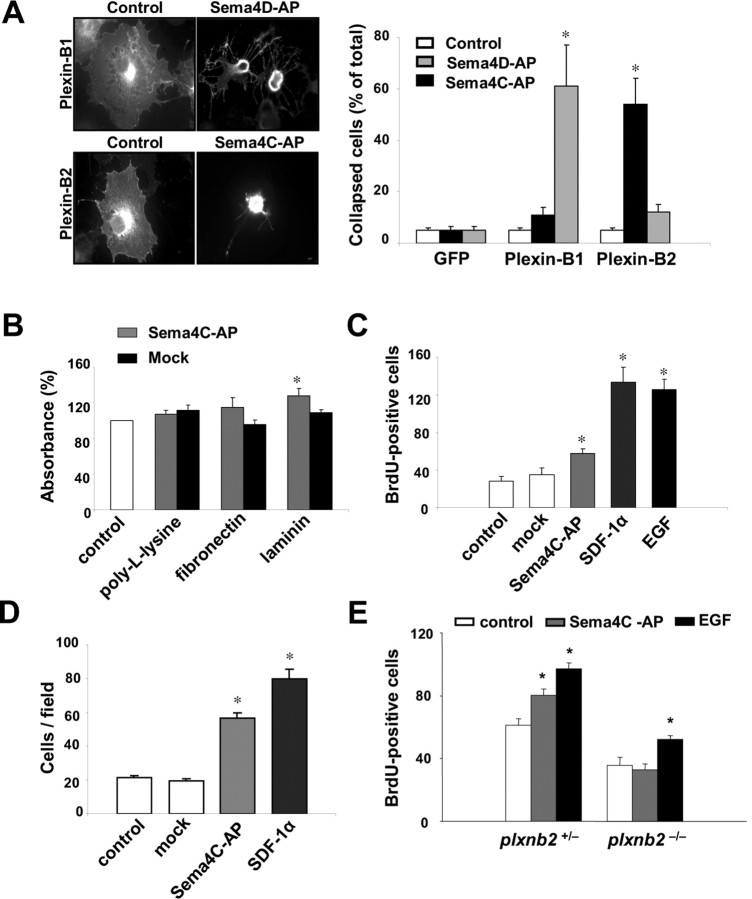
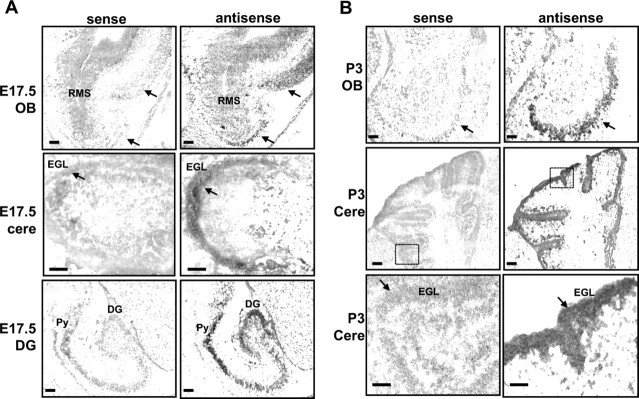
Semaphorins and their receptors, plexins, have emerged as important cellular cues regulating key developmental processes. B-type plexins directly regulate the actin cytoskeleton in a variety of cell types. Recently, B-type plexins have been shown to be expressed in striking patterns in the nervous system over critical developmental windows. However, in contrast to the well characterized plexin-A family, the functional role of plexin-B proteins in neural development and organogenesis in vertebrates in vivo is not known. Here, we have elucidated the functional contribution of the two neuronally expressed plexin-B proteins, Plexin-B1 or Plexin-B2, toward the development of the peripheral nervous system and the CNS by generating and analyzing constitutive knock-out mice. The development of the nervous system was found to be normal in mice lacking Plexin-B1, whereas mice lacking Plexin-B2 demonstrated defects in closure of the neural tube and a conspicuous disorganization of the embryonic brain. After analyzing mutant mice, which bypassed neural tube defects, we observed a key requirement for Plexin-B2 in proliferation and migration of granule cell precursors in the developing dentate gyrus, olfactory bulb, and cerebellum. Furthermore, we identified semaphorin 4C as a high-affinity ligand for Plexin-B2 in binding and functional assays. Semaphorin 4C stimulated activation of ErbB-2 and RhoA via Plexin-B2 and enhanced proliferation and migration of granule cell precursors. Semaphorin 4C-induced proliferation of ventricular zone neuroblasts was abrogated in mice lacking Plexin-B2. These genetic and functional analyses reveal a key requirement for Plexin-B2, but not Plexin-B1, in patterning of the vertebrate nervous system in vivo.


Figures

Figure 1.
Figure 1.
Expression analysis of plexin-B family members via mRNA in situ hybridization in GCPs and effects of Sema4D on GCP adhesion, proliferation, and migration. A, Plexin-B1 mRNA is expressed in the EGL (arrowheads) and IGL (arrows) of the cerebellum at postnatal day 3 (P3), whereas plexin-B2 is only expressed in the EGL. B, plexin-B2 mRNA is expressed in the outer proliferative layer (dashed lines) as well as inner premigratory (anti-TAG-1-immunoreactive) layer of the EGL as seen in adjacent cerebellar sections. C, D, In situ hybridization at E15.5 shows plexin-B2 expression in a migratory stream (arrowheads) along the lateral ventricle (LV), which is revealed to comprise GCPs by colabeling an adjacent section with anti-NeuroD antibody (D). D, Arrowheads indicate the migratory route of dentate GCPs. Sema4d mRNA is expressed in the vicinity of plexin-B2 (C, arrows). E, plexin-B1 and plexin-B2 are expressed in the RMS during postnatal stages. Dashed lines indicate the border of the developing olfactory bulb (OB). F, Neither pSema4D nor concentrated Sema4D-AP influenced adhesion of GCPs derived from P5 EGL to poly-l-lysine, fibronectin, and laminin. G, Neither pSema4D nor Sema4D-AP affects BrdU incorporation into GCPs derived from P5 EGL. H, Quantitative summary and typical examples showing that SDF-1α and pSema4D stimulated migration of dissociated cerebellar GCPs. *p < 0.05 compared with mock-treated cultures (for Sema4D-AP) or cultures treated with DMEM alone (for SDF-1α or pSema4D). Scale bars: B, 10 μm; A, C–E, 25 μm.
Figure 2.
Figure 2.
Generation and characterization of mice lacking Plexin-B1 in a constitutive manner (plxnb1 −/−). A, Targeting strategy for generation of mice lacking exons 13–16 of the plxnb1 gene. Red triangles indicate loxP sites. K, KpnI; Sh, SphI; X, XhoI. B, Southern blot analysis of correctly targeted ES cell clones analyzed according to the scheme shown in A. WT, Wild type. C, Southern blot analysis of heterozygous mutant mice and wild-type littermates analyzed according to the scheme shown in A. D, Demonstration of the loss of plexin-B1 mRNA transcript in the brain of adult homozygous mice at E17.5 via Northern blot analysis. The numbers indicate size in kilobase in B–D. E, Nissl staining and anti-CNPase immunohistochemistry show that the gross morphology of the brain nuclei and the fiber tracts, respectively, are unaltered in adult plxnb1 −/− embryos compared with wild-type littermates. F, Whole-mount anti-neurofilament M immunostaining reveals normal trajectories of cranial (left panels) and spinal nerves (right panels) plxnb1 −/− embryos and wild-type littermates at E12. G, Spinal connectivity of populations of sensory nerves identified via anti-substance P immunoreactivity and Isolectin-B4 binding is developed normally in plxnb1 −/− mice. Scale bars, 25 μm.
Figure 3.
Figure 3.
Generation and characterization of mice lacking Plexin-B2 in a constitutive manner. A, Targeting strategy for generation of mice lacking exons 19–23 of the plxnb2 gene. Red triangles indicate loxP sites. Sp, SpeI; B, BamHI; A, AseI. B, Southern blot analysis of correctly targeted ES cell clones analyzed according to the scheme shown in A. WT, Wild type. C, Southern blot analysis of heterozygous mutant mice and wild-type littermates analyzed according to the scheme shown in A. D, Demonstration of the loss of plexin-B2 mRNA transcript in the brain of homozygous embryos at E17.5 via Northern blot analysis. The numbers indicate size in kilobase in B–D. E, Gross morphology of plxnb2 −/− embryos and wild-type littermates at E9.5. Plxnb2−/− embryos demonstrate an open neural tube (arrows) and exencephaly (arrowheads). F, Nissl staining on coronal sections of plxnb2 −/− embryos and wild-type littermates at E9.5 shows an open neural tube in the forebrain and hindbrain regions, but not in the spinal neural tube, in plxnb2 −/− embryos (n = 5). G, Nissl staining on sagittal sections of plxnb2 −/− embryos and wild-type littermates at E17.5 reveals an inversion of the brain (black arrowheads) with an overlying diencephalon (Di), enlarged ventricles, and hypotrophic ventricular germinative zone (red arrowheads) and a disruption of the rostral migratory stream and olfactory bulb (black arrows) in plxnb2 −/− embryos (n = 5). H, Some plxnb2 −/− embryos do not develop exencephaly (black arrowheads) but still show enlarged ventricles and hypotrophic ventricular germinative zone (red arrowheads; n = 4). Scale bars, 25 μm.
Figure 4.
Figure 4.
Characterization of the defects in development of the dentate gyrus in plxnb2 −/− embryos at E17.5 and E18.5. A, The migratory stream of GCPs (marked by red arrows) is severely reduced and disoriented in plxnb2 −/− embryos. Boxed areas at the top are magnified in the lower panels. Py, Developing pyramidal cell layer; DG, dentate gyrus. Red arrowheads indicate radially migrating neuroblasts: yellow arrow points to the disrupted ventricular wall in plxnb2 −/− embryos. B, Retarded migration (black arrowheads) of NeuroD-expressing GCPs into the DG anlage. NeuroD immunoreactivity is decreased in wild-type littermates at E18.5 and restricted to the DG (dashed arrow). The E18.5 plxnb2 −/− embryo shown here did not develop exencephaly. C, Differentiating granule cells identified via anti-Prox-1 immunoreactivity (green) in the developing DG (white arrowheads) are reduced in plxnb2 −/− embryos and found in ectopic locations (white arrows). Immunoreactivity toward neuron-specific β-tubulin III (orange) reveals a disruption of the migratory pattern of neuroblasts (white arrowheads) in plxnb2 −/− embryos accompanied by ectopic β-tubulin III-expressing cellular aggregates (white arrows, magnified in inset). D, GFAP-expressing radial glia are present in plxnb2−/− embryos but demonstrate abnormal morphology and a disruption of the ventricular wall with ectopically located cells in the lateral ventricle (LV). Scale bars: D, 10 μm; B–D, 25 μm. n = 3 plxnb2 −/− embryos each with or without exencephaly and equal number of wild-type controls.
Figure 5.
Figure 5.
Analysis of defects in GCP migration and cerebellar foliation in plxnb2 −/− mice at E17.5 and E18.5. A, Nissl staining revealed a retarded development of the cerebellar primordium and EGL in plxnb2 −/− mice compared with wild-type (plxnb2 +/+) littermates, which showed a clear EGL (arrowheads, top panel) and a developing layer of Purkinje cells (arrow). Cerebellar foliation (arrowheads) is clearly evident in wild-type mice at E18.5 but not in plxnb2 −/− mice, including those that did not develop exencephaly. B, plexin-B2 mRNA is detected via in situ hybridization in the cerebellar anlage, EGL, and choroid plexus (CP) at E15.5 and E17.5. C, At E17.5, NeuroD-expressing GCPs are clearly patterned in the EGL of wild-type mice, whereas plxnb2 −/− mutants demonstrate an irregular EGL (arrowheads) and cells that had not migrated into the EGL (black arrow). Migration of granule cells into the IGL is evident in wild-type mice at E18.5 (red arrow) but not in plxnb2 −/− embryos. D, TAG-1 immunostaining reveals a layer of differentiating premigratory granule cells (arrows) in wild-type mice but not in plxnb2 −/− mice. Scale bars, 25 μm. n = 3 plxnb2 −/− embryos each with or without exencephaly and equal number of wild-type controls.
Figure 6.
Figure 6.
Analysis of olfactory development and proliferation of neuroblasts in plxnb2−/− embryos. A, Plxnb2 −/− mice that bypass exencephaly show defects in lamination of the olfactory bulb at E18.5 compared with wild-type littermates. Several PSA-NCAM-expressing or GAD-67-expressing neuroblasts migrate out of the RMS into olfactory bulb laminas in wild-type mice but are largely retained in RMS of plxnb2 −/− embryos. Boxed areas are represented at a higher magnification in middle and lower panels. Scale bars, 25 μm. n = 3 plxnb2 −/− embryos each with or without exencephaly and equal number of wild-type controls. OE, Olfactory epithelium.
Figure 7.
Figure 7.
Analysis of defects in proliferation of neuronal precursors in plxnb2 −/− embryos. A, The number of Ki-67-expressing proliferating neuroblasts is strongly reduced in the forebrain ventricular germinative zone (arrowheads) as well as the cerebellar EGL of plxnb2 −/− mice compared with wild-type littermates at E17.5. Insets show Ki-67-immunoreactive cells in the germinative zone and the ventricles of plxnb2 +/+ mice and plxnb2 −/− mice, respectively. V, Ventricle. B, In BrdU-labeling experiments at 24 h after a BrdU pulse given at E16.5, labeled GCPs populate the cerebellar EGL of wild-type littermates (arrowheads), but not in plxnb2 −/− mice. Top, Nissl-stained adjacent sections. CP, Choroid plexus. Scale bars, 25 μm. n = 3 plxnb2 −/− embryos each with or without exencephaly and equal number of wild-type controls.
Figure 8.
Figure 8.
Sema4C binds and activates Plexin-B2. A, Preparations of AP-tagged Sema4D and Sema4C (∼2 nm each) specifically bind COS7 cells heterologously expressing Plexin-B1 and Plexin-B2, respectively, but not Plexin-B3, as detected via histochemical detection of AP activity. Expression of plexins was verified via Western blotting. A weak interaction between Plexin-B2–Sema4D and Plexin-B1–Sema4C could be detected after prolonged histochemical reaction. B, Binding kinetics as determined by incubating increasing ligand concentrations with Plexin-expressing cells (as above). The amount of bound semaphorins was measured by revealing the associated AP activity with a colorimetric substrate (see Materials and Methods). C, Pull-down assay for activated RhoA showing that treatment of HEK293 cells with Sema4C-AP leads to RhoA activation, which is potentiated after overexpression of Plexin-B2 and abolished after overexpression of a C-terminal deletion mutant of Plexin-B2 (Δ-C terminus). In parallel, treatment of HEK293 cells with Sema4C-AP results in phosphorylation of ErbB-2, which is potentiated after overexpression of Plexin-B2 and unaffected by expression of a C-terminal deletion mutant of Plexin-B2. Bottom panels show expression levels of RhoA, endogenous ErbB-2 as well as endogenous and overexpressed Plexin-B2 in cell lysates. WT, Wild type; DN, Dominant negative; IB, immunoblot.
Figure 9.
Figure 9.
Cellular effects of Sema4C on COS cells, developing granule cells, and ventricular zone neuroblasts. A, Typical examples and quantitative summary of Sema4D- and Sema4C-induced collapse of COS7 cells expressing Plexin-B1 and Plexin-B2, respectively. GFP-expressing cells serve as a negative control. B, Concentrated medium containing Sema4C-AP weakly enhanced adhesion of GCPs derived from P5 EGL to laminin, but not to poly-l-lysine or fibronectin. C, BrdU incorporation assays showed that Sema4C-AP significantly stimulates proliferation of GCPs derived from P5 EGL; SDF-1α and EGF served as positive controls. D, Quantitative summary of Boyden chamber migration assays on P5 GCPs revealed significant stimulatory effects of Sema4C-AP and SDF-1α (positive control) on migration of dissociated cerebellar GCPs. *p < 0.05 compared with mock-treated cultures (for Sema4C-AP) or cultures treated with DMEM alone (for SDF-1α or EGF). E, BrdU incorporation assays showed that Sema4C-AP significantly stimulates proliferation of ventricular zone neuroblasts derived from wild-type embryos but not their plxnb2 −/− littermates at E17.5. EGF served as a positive control. *p < 0.05 compared with mock-treated cultures.
Figure 10.
Figure 10.
Expression analysis of Sema4c mRNA via in situ hybridization in the developing olfactory bulb (OB), cerebellum (Cere), and dentate gyrus (DG) at E17.5 and P3. Images with sense probes are included in the left panels as controls. A, B, Sema4c mRNA is expressed in target zone of the RMS and in the adjoining cortical plate (arrows) in the developing OB at E17.5 at low levels (A, top) and at P3 at higher levels (B, top). Sema4c is detectable in the EGL of the cerebellum at E17.5 (A, middle, arrows) and at P3 (B, middle and bottom, arrows; the bottom shows a magnified view of the boxed areas in the middle). Sema4c is expressed in developing dentate gyrus (DG) as well as the developing pyramidal cell layer (Py). Scale bars, 25 μm.

Similar articles

Cited by

References

    1. Anderson LL, Jeftinija S, Scanes CG. Growth hormone secretion: molecular and cellular mechanisms and in vivo approaches. Exp Biol Med (Maywood) 2004;229:291–302. - PubMed
    1. Artigiani S, Barberis D, Fazzari P, Longati P, Angelini P, Van De Loo JW, Comoglio PM, Tamagnone L. Functional regulation of semaphorin receptors by proprotein convertases. J Biol Chem. 2003;278:10094–10101. - PubMed
    1. Artigiani S, Conrotto P, Fazzari P, Gilestro GF, Barberis D, Giordano S, Comoglio PM, Tamagnone L. Plexin-B3 is a functional receptor for semaphorin 5A. EMBO Rep. 2004;5:710–714. - PMC - PubMed
    1. Aurandt J, Vikis HG, Gutkind JS, Ahn N, Guan KL. The semaphorin receptor plexin-B1 signals through a direct interaction with the Rho-specific nucleotide exchange factor, LARG. Proc Natl Acad Sci USA. 2002;99:12085–12090. - PMC - PubMed
    1. Ayoob JC, Terman JR, Kolodkin AL. Drosophila Plexin B is a Sema-2a receptor required for axon guidance. Development. 2006;133:2125–2135. - PubMed

Publication types

MeSH terms